An old hole avoided and the latest dead in the water
Old news up north, but hotter-off-the-press down south.
I just stumbled across this paper from a few years back now. It was led by my colleague, Martyn Chipperfield, at the University of Leeds in the UK. I also contributed to it in a small way. I wish I’d thought of it when I was preparing a recent talk because it includes a plot that nicely demonstrates of the much smaller ozone amounts above the southern hemisphere compared with the north. That matters because lower ozone means higher UV.
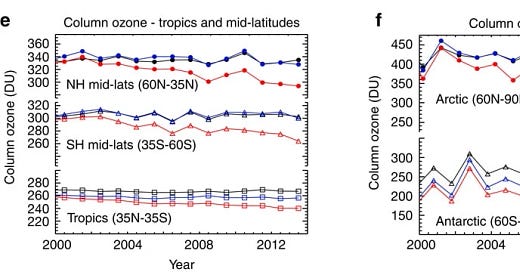
I’ve reproduced the relevant figure below. It includes just the first 14 years of the century because the main focus of the paper was to show that there would have been a real ozone hole in the Arctic in the spring of 2011 if the Montreal Protocol to protect the ozone layer had never been implemented. The figure compares measured (black) and modelled (blue) ozone amounts for several latitude ranges, and also shows (in red) what the ozone levels would have been without the Montreal Protocol. The ‘tropics’ and mid-latitudes are shown on the left, showing that mid southern latitudes have about 10 percent less ozone than corresponding northern latitudes. The red line shows that by the end of the period, ozone amounts at both northern and southern mid-latitude would have by then decreased by nearly 10 percent (the decrease by now would have been more than twice that).
In the tropics, ozone amounts are smaller. The small year-to-year changes there highlight the slight underestimation in calculated ozone. The blue line is clearly below the back line (more work needed by the modelling community). Projected decreases without the Montreal Protocol are smaller in this latitude range.
Springtime ozone amounts in polar regions are shown on the right, which highlights the huge disparity in ozone between the Arctic that doesn’t (generally) experience ozone holes, and the Antarctic that (unfairly for antipodeans) does. Year-to-year changes are larger, and in 2011 ozone amounts were unusually low because of different wind patterns that spring.
That unusual spring was the main focus of the paper. We showed (below) that when you look at the minimum Arctic ozone each day over that spring period, they weren’t very different from usual. The black points are measured values and the blue points are calculated (modelled) values. There was just a short period when ozone amounts were low enough to be considered an ‘ozone hole’ (with amounts lower to 200 DU, shown by the dashed line. But if you factor in the ozone reductions that would have occurred without the Montreal Protocol, there would have been huge reductions in ozone - comparable with the reductions seen each year in Antarctica, as shown by the red line.
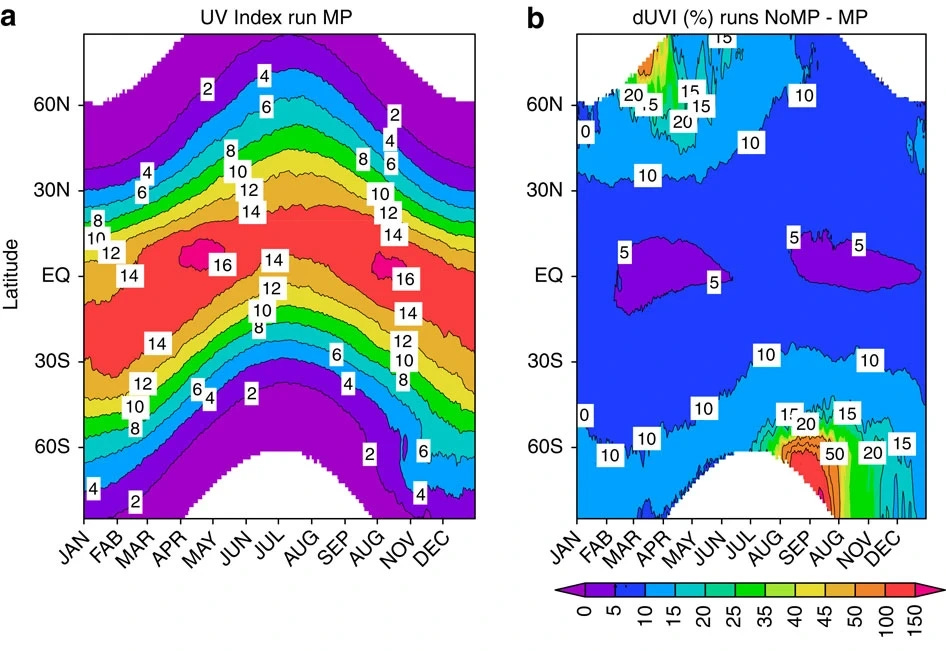
My part in the exercise was to help calculate the UV that penetrates to Earth’s surface, and to calculate the effect of these ozone changes on it. The mean UV Index (UVI) at noon is shown in the left panel below for the entire globe apart from the polar nights (white shading), illustrating the much higher UVIs near the equator, due mainly to the low ozone amounts, and higher sun elevations. There’s also that tendency towards higher values in the southern hemisphere, as I’ve mentioned before. These mean UVIs are smaller at higher latitudes because of the much lower values in winter.
The right panel shows the percentage increases in UVI that would have occurred if the Montreal Protocol had never been implemented. As you can see, if it hadn’t been implemented, percentage increases would have been progressively greater at higher latitudes. At the equator, increases would have been small, but the monthly mean UVI in the Arctic Spring that year would have been up to 50 percent greater (orange shading at top left). That’s still much less severe than in the Antarctic where the increases would have sometimes exceeded 100 percent (more than a doubling). Fortunately, in absolute terms the Arctic UVI changes aren’t not large because their normal values at those latitudes and dates are small (see left panel). Despite this being an anomalous year for the Arctic, the changes would have been much larger in Antarctica (as shown by the red and orange colours in September and October at the lower right).
Oops, I see now, more than a decade too late, that October is incorrectly labelled as another “AUG” on the x-axis of both panels. I don’t think we’ll be making a retraction soon 😊.
************************************
On to more timely news. This year’s Antarctic ozone hole finally petered out on 7 December. The composite images below show it’s final death throes.
From Paul Krummel at CSIRO, Australia .. The red line marks the boundary of the ozone hole. Note its rapidly diminishing area over the period 25 November to 10 December.
The series below show essentially the same data as above, but for a shorter period and from a different geographic perspective.
From the NASA ozonewatch website from 3 to 9 December …
That last plot shows the development and decay of this year’s ozone hole (black line) compared with the average since the 1979 (white line). The grey shading shows the full range of areas each day since the satellite record began. As you can see, this year’s hole, now dead and gone, was ‘very average’ … (if such a descriptor exists).


I guess another question what is density profile by latitude and altitude to 30km?
Richard,
Couple of questions. First looking a figure a (uv index run NP) if I understand it correctly. South and north look same per latitude except for perturbation from ozone hole in south spring months. Look at line 2 for each. Is this correct interpretation?
Second, tropics I guess is lower because of sun angle is more direct having a shorter path length through ozone layer. That does not seem quite correct as due to temperature and effect of earth spin atmosphere is thicker at equator, but perhaps that is secondary effect. Basically at 20km altitude air pressure is close to same at poles and equator. Sorry my ignorance I am EE but worked decades in atmospheric sciences so I likely have some misunderstandings of atmospheric science.
Regards
Patrick Grant