Clear-sky UV near the equinox Spring can be only half that near the Autumn equinox
Lucky thing too?
But not so for Antarctica. More on that next week…
And a nod to Gaia-fame’s James Lovelock, who died last month on his 103rd birthday.
Note added: 26 Aug 2020. A colleague reminded me that spring is usually taken as the period starting at the spring equinox (or sometimes starting three weeks before), rather than centered at the spring equinox, as assumed here. I’ve just modified things to clarify the intended message.
I’m quite pleased with our just-published paper that shows the measured relationship between ozone and UV radiation is in good agreement with calculations for several different biological weightings. These sensitivities are usually expressed in terms of what’s called a ‘Radiative Amplification Factor’ (RAF), which is just the percentage increase in UV that results from a one percent reduction in ozone. For example, if an ozone reduction of 1 percent causes sunburning UV to increase by 1.2 percent (as it does), then the RAF for sunburning UV is 1.2.
The study uses multi-year data from spectrometers developed at NIWA by my colleagues at Lauder, that have been deployed around the world. The four sites used in the study are widely-spaced geographically, two in each hemisphere. Two are at tropical latitudes (the high -altitude Mauna Loa Observatory in Hawaii, and Alice Springs, Australia), and two are mid-latitudes (Boulder Colorado, and Lauder New Zealand).
I found it satisfying that the relationships between UV and ozone could be deduced without having to resort to any other data sets. Statistics of the measured spectra themselves are used to remove effects of clouds and aerosols. The spectra are also used to retrieve the amount of atmospheric ozone. On the way, we show that the ozone amounts retrieved are in good agreement with other sources.
But the aspect I want to discuss here is incidental to all that. Because the sun elevation angle is such a strong determinant of the amount of UV radiation transmitted to the Earth’s surface, we first sorted the multi-year data set by Solar Zenith Angle (SZA, which is just 90 - the solar elevation angle). We then looked at the subset of clear-sky data for each SZA.
The results for Lauder (45S) were especially interesting, where about 18,000 clear-sky spectra were identified over the multi-year observation period. Like other mid-latitude sites, there’s a strong seasonal variation in ozone, with a spring maximum and autumn minimum. This seasonal variation is large enough at Lauder to impart a marked asymmetry in UVI between spring and autumn, as shown in the plots below.

But the most obvious feature of the first plot is the huge summer-winter contrast in UVI. At mid-summer, the peak UVI exceeds that at mid-winter by more than a factor of ten, due mainly to the shorter light path through the atmosphere when the Sun is high in the sky (i.e., when the SZA is smallest). But, following the coloured points across, it’s clear that autumn UVI values are also much higher than in spring for the same sun elevation. At Lauder’s latitude of 45S, data throughout the year are available only for SZAs greater than 67 degrees (sun elevation angles less than 23 degrees).
Outside the midday period, data are acquired mainly at 5-degree steps in SZA, and for each of the larger SZAs - when data are available year-round - there are more than 2000 clear sky spectra: several for each day of the year. The lower panel on above plot shows the near-perfect anti-correlation between the resulting average ozone and the corresponding average clear-sky UV for any day of the year. For the SZA shown (75 degrees), the mean UVI is about 50 percent greater near the autumn equinox than near the spring equinox, and those differences become larger for smaller SZAs.
Looking at individual spectra, the differences can be substantially larger. The plot below shows that for a given SZA the peak UVI (near the autumn equinox) can exceed the minimum (near the spring equinox) by more than a factor of two or more (with UVI ranging from less than 0.7 to greater than 1.4 times the mean).
From a human health perspective, it seems fortuitous (maybe even part of a ‘great design’ ? 😊) that the UVI is relatively low near the spring equinox compared with the autumn. In spring, following the sustained period of low UV over winter, our pallid skins are more sensitive to UV damage. As we emerge from the low UV winter climate, we are not immediately subjected to the highest UVI values for any given SZA. The higher ozone amounts have the effect of protecting our skins during the seasonal increase period. It’s only in autumn - after our skins have had a chance to acclimatise and adapt (by tanning) over summer - that the highest UV amounts for any SZA occur.
And could those lingeringly high UV amounts in autumn be Gaia’s way of helping us synthesise sufficient levels of vitamin D to sustain us over the winter period when little vitamin D is produced? The seasonal difference in the radiation that leads to the production vitamin-D is even larger than for UVI.
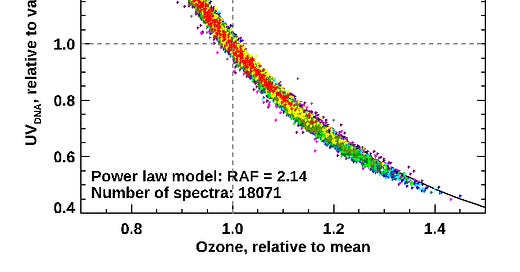
There may be even wider biological implications. For DNA-damaging radiation, which is twice as sensitive to ozone, the peak UV near the autumn equinox can exceed that for spring at the same SZA by a factor of four, as shown below, with DNA-weighted UV ranging from 0.45 to greater 1.8 times the mean.
Whoever designed this world we live in seems to know what (s)he was doing … 😊


And yes, BTW, I wonder how many students I showed the GAIA film to back in the 80's!
Very cool figures and exactly as predicted! Well done.