I have exciting news to share: You can now read UV & You in the new Substack app for iPhone.
With the app, you’ll have a dedicated Inbox for my Substack and any others you subscribe to. New posts will never get lost in your email filters, or stuck in spam. Longer posts will never cut-off by your email app. Comments and rich media will all work seamlessly. Overall, it’s a big upgrade to the reading experience. The Substack app is currently available for iOS. If you don’t have an Apple device, you can join the Android waitlist here.
Now, back to business…
The American Geophysical Union has just published a great distillation of the thousands of pages in the just-released IPCC report in just 5 telling Figures. I won’t reproduce them all here, but the article is well worth reading. It’s essentially just those 5 Figures with captions, and the Take- home message from each. Brilliant.
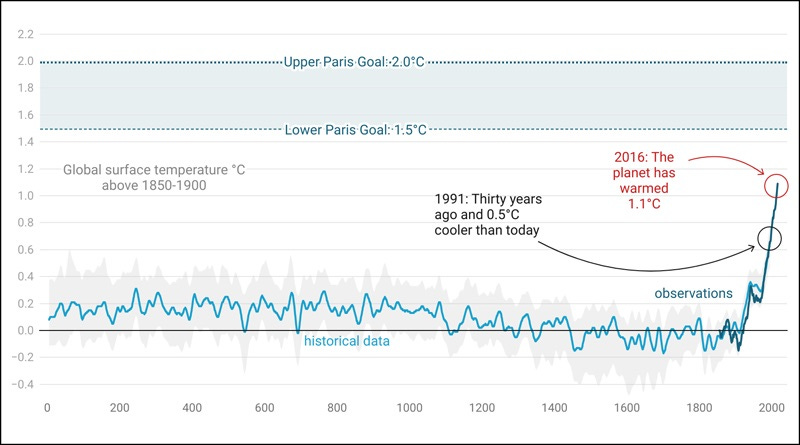
The first one is self explanatory. It shows temperature changes over the last 2000 years. The trajectory we’ve been on for the last 30 years is scary.
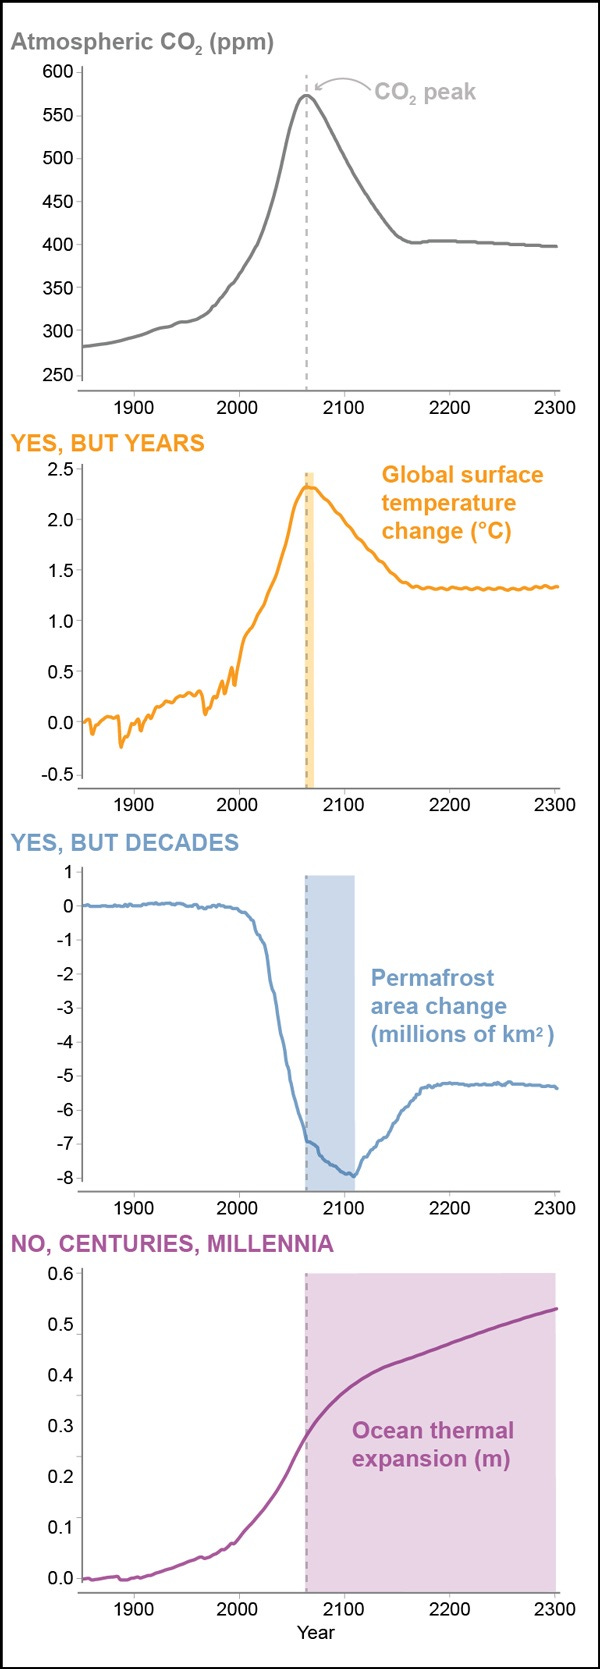
Their main message is to pour cold water on an idea that’s been suggested to make our task of controlling climate easier. The (bad) suggestion is that we allow some temporary “overshoot”. That is, allow temperatures to temporarily increase above the 1.5 to 2.0 degree limit specified at the Paris agreement up to about year 2050 before bringing in more aggressive carbon-capture to reduce them again. As the last figure in their article shows, it’s a bad idea because of the time scales involved.
Although the delay of 25 years seems small, the consequences for sea-level rise will be large, and will continue for centuries.
Their final figure is reproduced below. In four panels, it show the future effects of that delayed action on:
Concentrations of CO2 in the atmosphere
Global temperature
Permafrost area, and
Sea level rise.
Although the delay of 25 years seems small, the consequences are profound. For example, sea-level rise will be exceed 0.5 meters, and will continue for centuries.
Read the article for the 3 intervening graphs.
Take-home message: carbon dioxide reduction can’t wait
(but I think most of you already knew that)
Thanks for reading this. Previous posts on the intersection between Ozone, UV, Climate, and Health can be found at my UV & You area at Substack.


