Our UV App just got Bigger and Better
And it's still free. Download it to save lives .....
My friend Jerry Burke has just released a new version of his popular Smartphone app, GlobalUV, which is available at no cost both iPhone and Android devices (for Android Operating System version 8.1 or later).
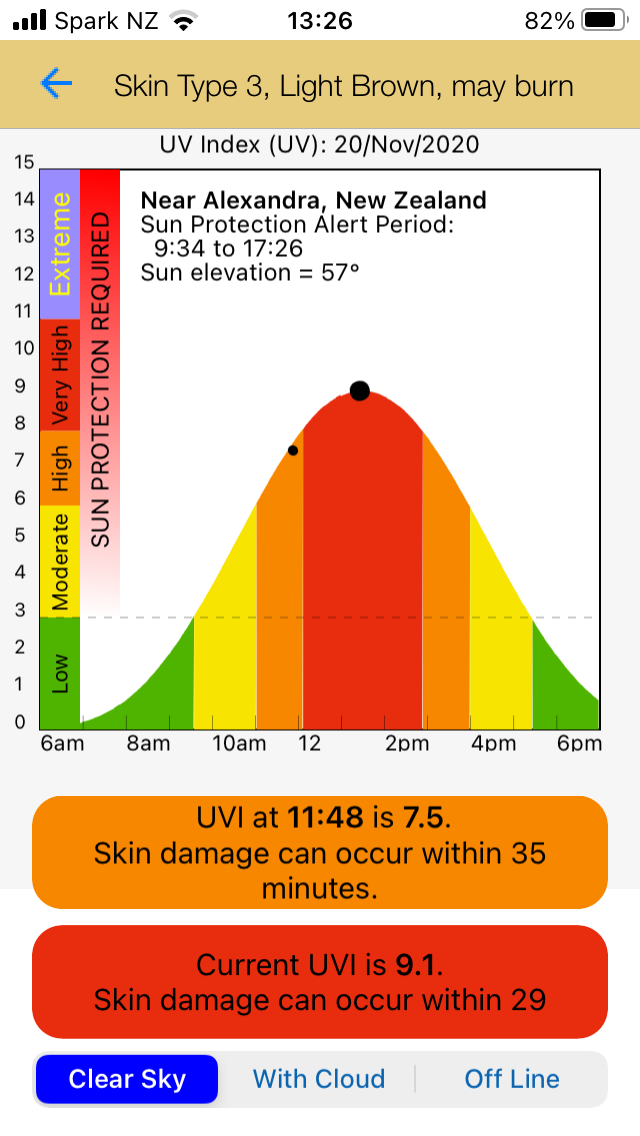
The app gives information about current UV levels and how they are expected to change over the day for any place in the world. It also give appropriate behavioural advice for your selected skin type. Ideal for planning your day to optimise health outcomes.
The first obvious improvement is a modernization of the user interface. Site selection is simplified by using standard mapping tools as well as being able to select a GPS option for your current site.
You can click on the colour-coded information boxes for more information. Results for clear skies can easily be compared with results for forecast cloud conditions, and for climatological ozone amounts using the offline version.
The educational functionality is also greatly improved by allowing the user to explore the variability of UV for other months of the year, and for other ozone amounts. The variability of UVI for each situation is displayed graphically as functions of time and location maps, as shown in the example below. In the android version, the sensitivity to clouds and aerosols can also be examined.
After playing with the app for a few minutes, the user will have a good appreciation of the variability of UV at any place and time. Every home should have one.
Old dyed-in-the-wool users can revert to the old interface if required. Click here if you want to know more about how it all works.
If you’re interested only in the New Zealand situation you should consider using our simpler UVNZ app (which supersedes the older uv2Day app, again available for both iPhone and Android, but only for recent operating systems).
It has better forecasts of cloud effects (to streamline data downloads, GlobalUV assumes the average noon cloud reduction at noon applies throughout the day) and is proudly supported by the Cancer Society of New Zealand. But it doesn’t have the educational capability of exploring the effects on UVI by selecting other months and ozone amounts.
Thanks for listening. Save lives. Tell your friends all about it. Click below to subscribe for more free occasional posts about UV, Health and Climate Change


Richard, you say that the UVNZ app graphically displays UVI for each situation as functions of time and location maps. Am I right in assuming that UVI at my particular time and location will be calculated by deriving a particular reading from relevant UVI instruments which NIWA operates and transmits real-time readings and then modifies real-time UV intensity at my location by calculating the effect of cloud cover at my location using weather maps produced by satellites every 15 minutes?