In the last couple of weeks I’ve shown plots of the distribution of UVI values for high sun conditions at Lauder New Zealand, and the high-altitude Mauna Loa Observatory in Hawaii. At Lauder there was a good match between measured and calculated values for clear skies, while at Mauna Loa, measured values tended to be greater than calculated due to reflections from underlying clouds. As I explained, you also expect measured values to exceed calculated values at all sites under partly cloudy conditions.
At the not inconsiderable risk of boring you with more of these plots, I thought I should show another useful result that can be gleaned. This time, by comparing results for pristine Lauder (latitude 45S, altitude 370 m), with those from not-quite-so-pristine Boulder, Colorado (latitude 40N, altitude 1,700 m). We’d set up one of our UV spectrometers there over twenty years ago to investigate geographic differences in UV. Boulder is 5 degrees of latitude closer to the equator than Lauder, and higher in altitude by about 1.3 kilometres. In clean air, the UVI increases with altitude by about 6 or 7 percent per kilometre, so if the air was unpollute you’d expect the peak UVI to be about 10 percent more at Boulder than at Lauder for similar ozone amounts.
But its air isn’t clean. Boulder is just 50 km up the road from the famous ‘Mile High’ Stadium in Denver, where a line painted on the grandstand marks the one mile level above sea level. That proximity to Denver also means it’s often affected by pollution from the city. Although Denver’s population is less than 1 million, pollution is often trapped in inversion layers in the atmosphere above the city and its surrounds. On some days it ranks as one of the world’s most polluted cities.
Boulder is far less polluted than Denver. During a sabbatical there years ago, my recollection is that it always seemed OK. But in the distance there was that ever-present smudge of brown cloud to the north-west above Denver. Apparently, some of those tendrils of smog regularly find their way to the air above Boulder.
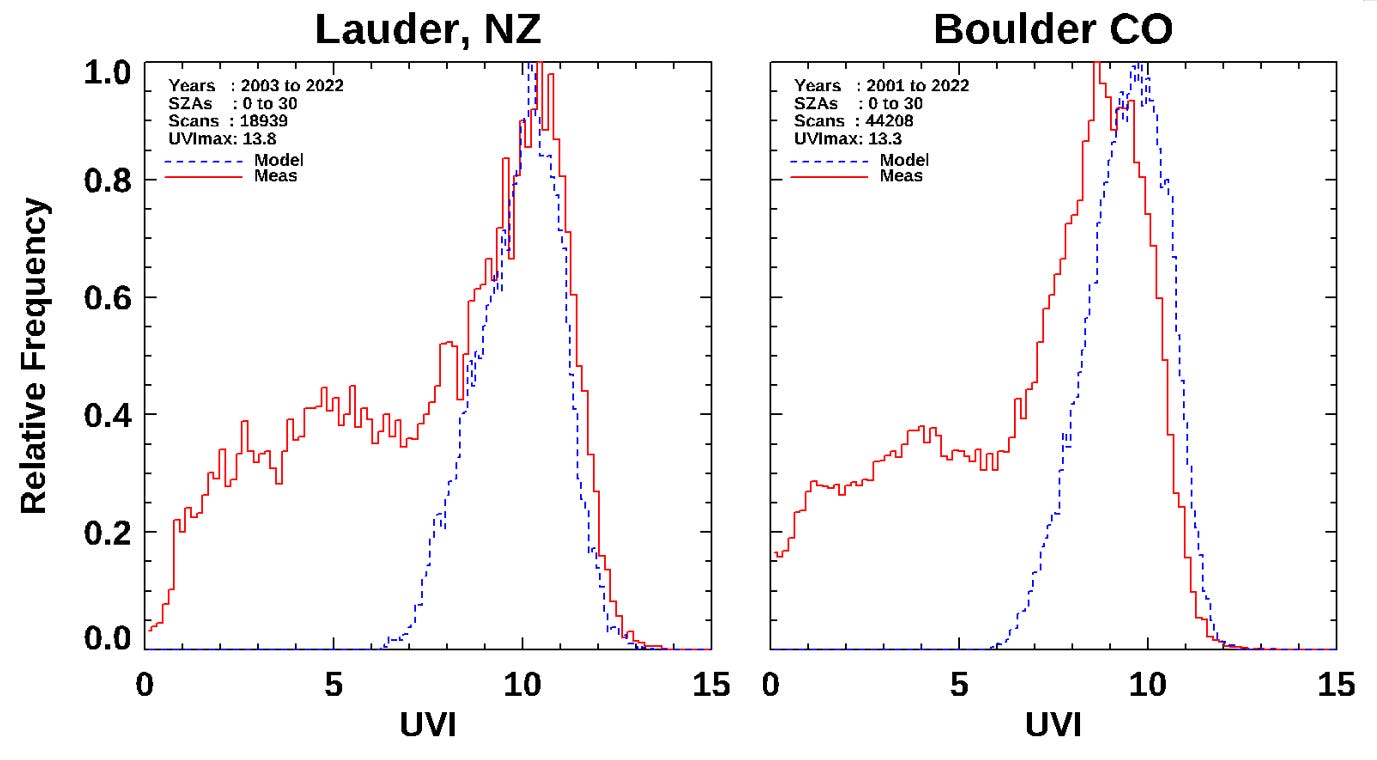
You can see the effect of that pollution by comparing the two panels below. At pristine Lauder (left panel), there’s a good match between measured (red) and calculated UVI for unpolluted clear-skies (blue), but at Boulder (right panel), the measured values are noticeably lower than those calculated, typically by more than 1 UVI unit: a reduction of more than 10 percent. That reduction would be much greater within the confines of Denver city.
At Lauder, the most frequent UVI is about 10.3, compared with Boulder’s 8.7. That’s about 15 percent lower at Boulder despite its higher sun elevation angles (because it’s closer to the equator), and despite its higher altitude.
Even the peak UVI measured at Lauder (13.8) is greater than at Boulder (13.3), but by a smaller proportion because of the higher sun elevation and because it’s not always polluted at Boulder.
The secondary maximum near UVI = 5 is lower at Boulder than at Lauder, showing that mean cloud effects are larger at Lauder. On the other hand, at Lauder the distribution drops off more quickly for low UVI than at Boulder, which implies that the combination of pollution and thick cloud conditions - that most severely reduce the UV - are more prevalent at Boulder. The frequency-of-occurrence of UVI-less-than-1 is three times as large at Boulder as it is at Lauder.
Calculated UVIs (blue) also tend to be slightly higher at Lauder (most commonly UVI = 10.2) than at Boulder (most commonly UVI = 9.8). That’s because of its lower ozone amounts and because of the closer Earth-Sun separation in the southern-hemisphere summer. The absolute peak calculated values are also higher at Lauder (UVI = 13) than at Boulder (UVI = 12).
This difference in UV between Lauder and Boulder is rather a nice vindication of an earlier result that I’ve commented on before. There we found - by analysing data from a network of broad-band UV instruments maintained by the US Department of Agriculture - that the peak UVI at Lauder New Zealand is about 40 percent greater than at equivalent latitudes in the USA. Only half of that difference could be explained by the lower ozone amounts in the south and the closer Earth-Sun separation in the southern hemisphere summer. We concluded that the remainder was due to pollution effects, which are apparently significant even at those predominantly rural sites in the USA.
Very interesting (I’m sure you all agree 😊).
It’s nice to see the result duplicated so clearly using the highest quality spectral measurements available. Again, I really should try to get this published for posterity in the peer-reviewed literature … Would anyone like to pay me to do it?
Who of you would have guessed that the UVI in southern New Zealand is worse than in the high-altitude Colorado desert? It’s just another good reason to avoid sun exposure in the New Zealand summer.


While it is of academic interest as to the variations at similar latitude locations and resolving he differences in those variations surely the point of the exercise (apart from academic interest which is important) is to compare data on such things as the comparative incidence of uv damage such as skin cancer and other impacts of uv on people. I.e. plot the comparative % incidence of uv damage at a range of global locations and theorise if the differences would be explained by ‘Covering up’