This is my first posting since completing “Saving our Skins”. All the chapters have been tidied a bit and the postings have been updated. I’d recommend reading those updates rather than the original versions that were emailed from Substack.
Before I start, I’d like to thank UNEP Panel colleagues Lars Olof Björn, Sasha Madronich and Ben Liley for their useful input and feedback. This turned out to be a bigger task than I’d thought when I began. We’re all agreed that more work is urgently needed to reduce uncertainties (maybe this should be the basis for a research funding proposal)
Inactivation of Covid-19 by UV in Sunlight (2000 words)
We’re told to stay at home during the Covid-19 lock-down. Here in New Zealand we’re told not to engage in outdoor activities like golf. But is that the best advice?
One thing that makes outdoors different from indoors is its presence of UV-B radiation from the Sun. That’s because those UV-B wavelengths are not transmitted by glass windows. This indoor/outdoor difference has two possibly important health effects.
Firstly, solar UV radiation interacting in our skin with 7-dehydro cholesterol (a precursor of cholesterol) is the first step in the production of vitamin D. There’s a body of literature out there suggesting that higher levels of vitamin D could provide protection. So, at this time in particular perhaps we should be seeking a bit of exposure to sunlight to keep those vitamin-D levels high. In winter there may not be enough, so it may be prudent then to attempt to boost your vitamin D levels through supplements, especially in New Zealand where few foods are fortified with vitamin D. For adults, daily doses of 1000 to 2000 IU are commonly prescribed, so are within the range of safety. Some advocate much higher levels (e.g., 10,000 IU/day), but such large doses may come with other risks. Seek advice from your medical practitioner.
Secondly, while it’s said that Covid-19 can survive on surfaces for several days, that may not always be the case for outdoor surfaces exposed to sunlight. Viruses contains RNA or DNA, which are susceptible to damage by UV-B radiation. If they’re anything like other small organisms, that sensitivity will be extremely high. In a paper I co-authored with Sasha Madronich and Lars Olof Bjorn, we found that the lifetime of much microbial life investigated was less than 1 second in sunlight.
Is it the same for the Covid-19 virus? More research is urgently needed to assess its inactivation by UV. The work may be dangerous, but the potential benefits are huge. The solution to the pandemic may – or may not - be staring us in the face.
With total diameters around 0.1 microns for the Covid-19 virus, there’s little room for ‘skin’ protection against UV damage for its genetic material. That material is RNA rather than DNA. Here I assume the wavelength dependence of damage to RNA is similar to that for DNA [1], as illustrated by the blue curve below, which shows that longer wavelengths are far less damaging (by a factor of a million - note the log scale on the vertical axis). The red curve for skin-damage leading to sunburn (i.e., erythema) is similar in shape but not as steep. Like skin cancer, erythema is also probably DNA-related but additionally includes the effects of skin transmission.
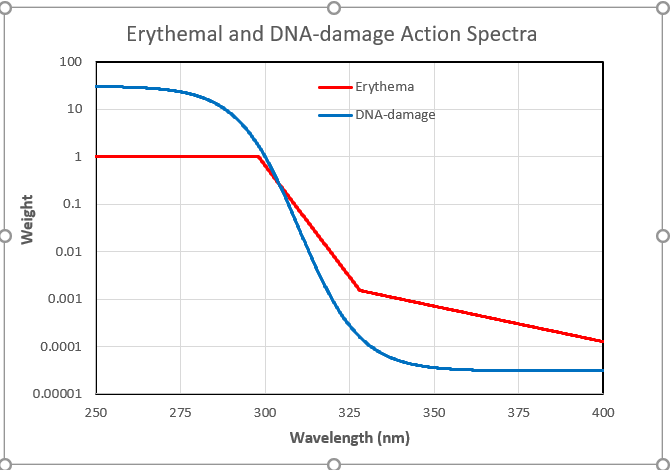
Notice that the spectrum for DNA damage is arbitrarily normalized to unity at 300 nm. But the experiments to determine virus sensitivity usually use UV-C radiation from a mercury lamp, which emits near 254 nm. At that wavelength the damage to DNA is higher by a factor of 30. That factor needs to be taken into account in any calculations.
There’ve been several attempts to measure the susceptibility of RNA-type viruses like SARS to UV radiation (the Covid-19 virus is yet to be studied). These are summarized in the appendix which shows that the amount of UV needed varies from species to species. It also depends on the endpoint chosen. For example, it takes far longer to inactivate 99 percent of viruses than 90 percent of them. Here I’ve used the 90 percent inactivation dose of 20 J/m2, which represents one of the more sensitive estimates.
Now I’ll use these virus sensitivity measurements and their wavelength dependence - along with calculations of the ambient UV - to answer the question: to what extent can viruses like these be inactivated by UV in sunlight?
I live in Southern New Zealand. Because I’m most interested in the situation here, I started by using the TUV model to calculate the peak (solar noon) UV irradiance on the first day each month for my workplace at nearby Lauder (45°S, altitude 370 m a.s.l.). For the calculation, I used a climatology of mean monthly ozone amounts. The results are displayed below.
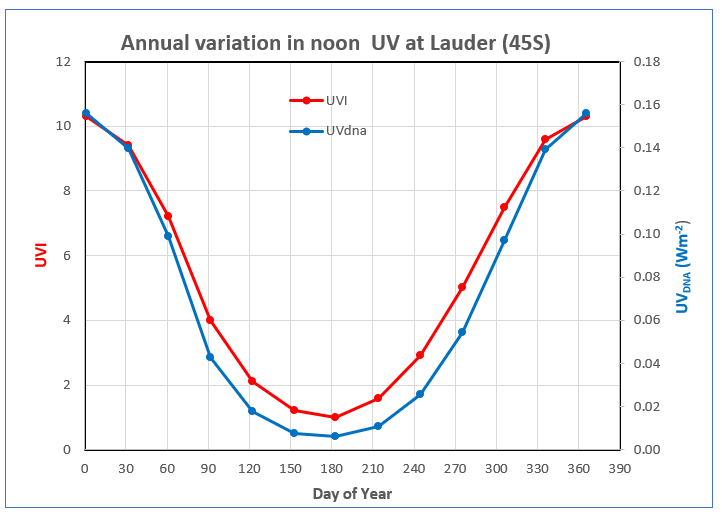
The plot shows the large seasonal variation in UVI that’s typical at mid-latitude sites, with winter values being only ten percent of those in summer (red line). Because DNA-weighted UV is confined to shorter wavelengths where atmospheric absorptions are stronger, its seasonal variation is even larger. In winter it’s less than 5 percent of that in summer (blue line). The calculated values are in good agreement with measurements undertaken at Lauder for clear sky conditions. These summer-winter seasonal contrasts would be similar at northern mid latitudes.
So far, the radiation I’ve been talking about is that falling on a horizontal surface. For other surface orientations, inactivation times are generally longer. For downward pointing surfaces there’s little inactivation at all because hardly any energy at these UV wavelengths is reflected from the ground. On the other hand, surfaces that point towards the sun (i.e., normal to the sun) receive more UV, so the inactivation times are shorter. Airborne viruses are exposed to radiation coming from all directions, which approximately doubles their total UV exposure compared with that on a horizontal surface. The inactivation time for airborne viruses is therefore about half that for viruses on horizontal surfaces. The seasonal variation in the resulting inactivation times (in hours) for those three cases is shown below.
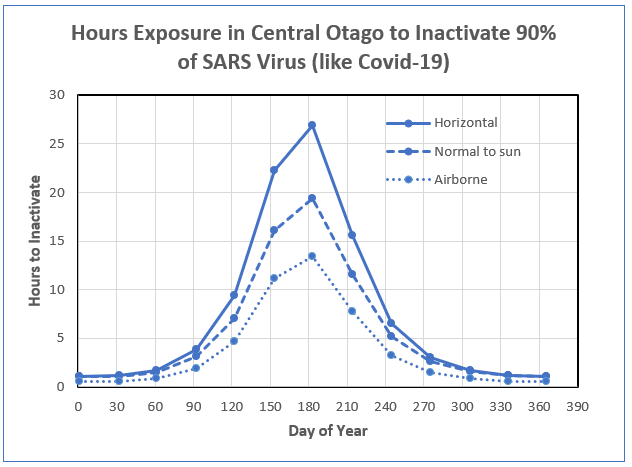
The plot shows that in the south of New Zealand, inactivation on a horizontal surface occurs after an hour or so in summer sunlight. However, outside the summer period, there is little chance of inactivation. The calculated number of hours shown also assumes the UV remains constant throughout that period. In the real world, the UVI decreases sharply outside the noon period, so the inactivation times required will continue to increase rapidly. Therefore, at this location in Southern New Zealand for the entire period between 1 April and 1 November there is insufficient UV throughout the entire day to inactivate 90% of the virus.
That’s no doubt an important factor leading to viral infections being so much more serious in the winter months. In northern New Zealand the winter UV is much higher than in the south, so useful inactivation can occur over a longer summer season. That’s also consistent with viral infections being worse in the south of the country.
There’s a large uncertainty in these estimates because inactivation times for the various forms of the coronavirus studied so far range from 7 to 241 J/m2. For the lower limit, the inactivation times would be shorter by a factor of 3, and for the upper limit, they’d be longer by a factor of 10. The inactivation periods would be about three times longer if the just published mean inactivation dose of 67 J/m2 for all coronavirus types is used as a proxy for Covid-19. More work to determine the sensitivity of the covid-19 virus in particular is urgently needed.
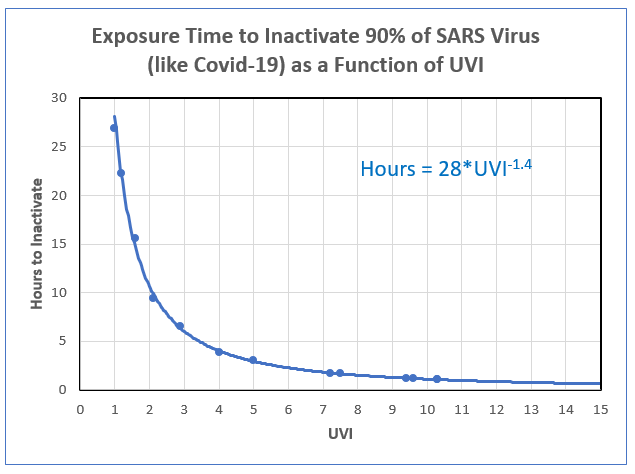
The inactivation time for any other place and location can be estimated from its relationship with UVI, as shown in the plot below. If you don’t know the UVI at your place, don’t worry. It’s available for any time and place using free smartphone apps like GlobalUV, uv2Day, or UVNZ.
Viruses can also be inactivated by high temperatures, but the study by Weiss & Horzinek (1986) on the Berne virus found that there was no inactivation below 20C, and the virus could survive against thermal stress for more than100 days at a temperature of 4C. But, to get appreciable thermal inactivation within a few hours, temperatures greater than 30C were required.
In conclusion, although these viruses are far more resilient to UV damage than the tiny airborne microbes we reported on previously, there is nevertheless some useful sensitivity. At noon in summer UV from sunlight inactivates the SARS virus in about 1 hour if it is exposed to sunlight.
Assuming a similar sensitivity for Covid-19, the risk of contagion from sunlit outdoor surfaces is probably less than 1 day in summer. But, when the sun is lower in the sky, such as in winter at mid latitudes, there’s insufficient UV in the whole daylight period for inactivation, so the virus will survive.
Exposure to sunlight is therefore useful for virus inactivation, but only for UVI greater than some threshold (say UVI > 8, for which the inactivation period could be less than a couple of hours).
Strategies to lower your personal risk of infection from the virus by exposure to sunlight therefore come at the cost of increasing your risk of skin damage. In this case, the exposure time to inactivate 90 percent of the virus is much longer than the time to induce skin damage. We don’t yet know if that will be the case for Covid-19. The times could be shorter or longer.
But, given that there will be some virus inactivation, and given that your vitamin D will increase, some deliberate UV exposure for short periods when the sun’s high in the sky may be a price worth paying. Just make sure you avoid sunburn because that’s a risk factor for skin cancer. About 500 New Zealanders will die from skin cancer this year (a few more than the number killed on our roads). It remains to be seen if Covid-19 is better or worse, but mortality from it occurs within days or weeks of infection, compared with decades after UV exposure for skin cancer.
[1] One of the uncertainties in these estimates is the assumption that UV damage to RNA is similar to that for DNA. In support of that, in 2005 Lytle and Sagripanti published a spectrum for RNA that was very similar to that for DNA. Conversely, a paper just published by Silverman (2019) found significant differences. But questions remain. In a follow-up I’ll have a look at how using the new RNA spectrum might changes the inactivation times calculated here.
Sign up for more …
Appendix (but only if you’re interested in the details)
The time required for virus inactivation is defined as:
T [in seconds] = Inactivation dose [in J/m2]/ Dose rate for equivalent damage [in W/m2], where, by definition, 1W = 1 J/s.
Inactivation doses have been reported by several groups: Weiss & Horzinek, 1986, Darnell et al, 2004, Kariwa et al, 2006, Kowalski et al., 2009, Eickmann et al., 2020l, Kowalski et al., 2020. (those hot links got lost in the table image below)

Note that the larger inactivation doses in the table are for endpoints with extremely low survival rates of the virus. In these calculations (and in the table below) I’ve used the 90 percent inactivation dose of 20 J/m2.
In that case, T = 20 * 30/ UVdna, where the factor of 30 is to renormalize the action spectrum as discussed above.
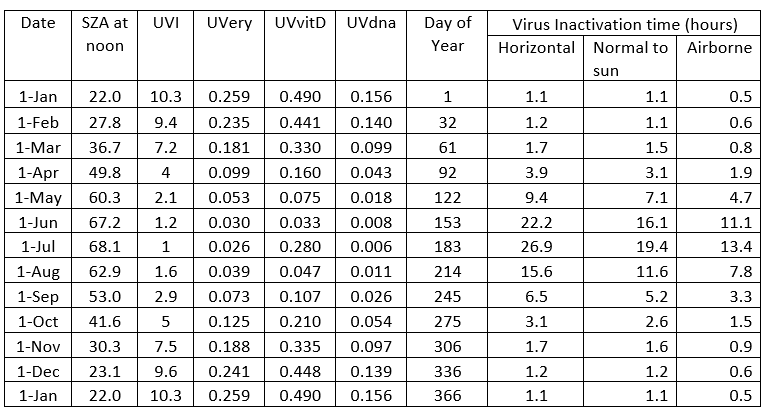
The table below gives numerical values for the results displayed in the above plots. From my file Virus inactivation by UV.xlsx. Inactivation times are approximate.
SZA= Solar Zenith Angle = 90 - (Solar Elevation Angle).
