How Lauder became the world’s best site for studying atmospheric ozone.
Updated September 4, 2021
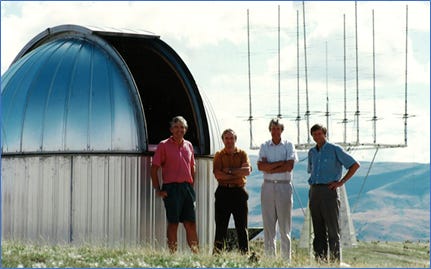
Meanwhile at Lauder, instruments to measure ozone itself, as well as gases related to ozone chemistry, were starting to take over from the old instruments to measure the more arcane faint auroral glows from the upper atmosphere. The picture below shows the main players in this changing emphasis.

By the time I “retired” in 2012, the total column amount of atmospheric ozone was being measured at Lauder with a plethora of techniques, from the Dobson spectrophotometer, the UV spectrometers which used absorption of sunlight to automatically give total column amounts throughout the day for every day of the year, to the DOAS instruments. We’d even tried measuring it from its absorptions in the infra-red region.
In addition to those column measurements, we also had several instruments to measure its distribution with altitude. These included balloon-soundings (with “sondes”), a lidar instrument, and microwave radiometers.
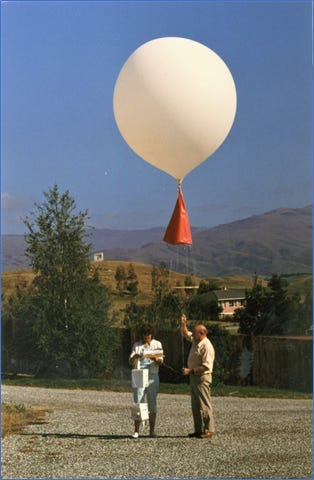
Most of the measurement systems at Lauder use remote sensing of radiation, usually from the Sun. But not the ozone sondes. They use a form of in-situ monitoring. Ozone in the vicinity of the ascending or descending balloon is measured by pumping outside air through a cell containing a chemical solution of potassium iodide. A voltage proportional to the ozone concentration is induced in the cell. The stretchable plastic balloons that carry the payload aloft are filled with hydrogen to a diameter of a couple of metres at launch. But as it ascends and the outside pressure reduces, the balloon expands. A couple of hours later it reaches altitudes around 30 km where the atmospheric pressure is only about 1 percent of that at the surface. By that time, the balloon has expanded so much that it bursts, and over the next hour or so the package then parachutes back to the ground.

We also deduced coarse profiles from the Dobson instrument by viewing light scattered from the overhead (zenith) sky and seeing how the ozone signal changed over the twilight period - the so-called “Umkehr” method.
The value of long-term data sets was at last being appreciated. And data from unpolluted sites like Lauder are the best. Attacking the problem of ozone depletion had become the main focus of Lauder research.
The ozone measurement methods are quite complementary to each other. Balloon sondes cover the altitude range from 0 to 30 km, but can be launched only in calm conditions, and are restricted in number because of their cost. The microwave radiometer, which senses emissions from the atmosphere, can operate continuously, but the measurements are accurate only under a limited range of weather conditions. It covers the altitude range from about 15 to 80 km, but with a much lower vertical resolution, so it gives much less detail than the balloon measurements.
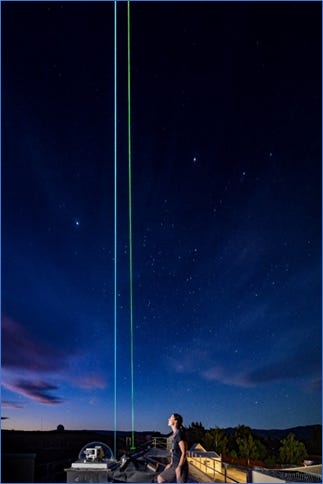
Most accurate is the ozone lidar, but it can operate only at night under cloud-free conditions. It can measure the altitude profile in great detail from 6 km to 90 km. It’s probably the most expensive bit of gear at Lauder and was installed in 1995 by the Dutch Research Group called RIVM – which translates in English to “Research for Man and the Environment”. A photocopied newspaper clipping on the wall behind it reminds visitors that it was officially opened by the then Minister of Science, Simon Upton. He was the youngest and in my opinion the best we’ve had in that role. He was a Rhodes Scholar and had a good understanding of environmental issues: and it was he who later set up the Crown Research Institutes in New Zealand to replace the old DSIR. He’s no longer in politics, and since his return to New Zealand in 2017 has taken up the role of Parliamentary Commissioner for the Environment where he is championing cross-party support for action on
climate change.
I’d like to explain how some of these instruments work to give an insight of what we do and how ingenious they are. It’s a bit more technical than the rest of the story, so I hope you won’t feel too swamped by it. But if you do, please just skim through the next couple of pages.
The ozone lidar
What is it? It’s an example of a Differential Absorption Lidar (DIAL). Atmospheric science is littered with acronyms like this, and this one is an example of a “nested” acronym, because the “L” is an abbreviation for another acronym, Lidar. You’ve probably heard of radar, which is sometimes written RADAR, as it’s an acronym for Radio Direction and Ranging. Lidars are similar but use light instead of the much longer wavelength radio waves in radar. So, by analogy, LIDAR is an acronym for Light Direction and Ranging. Unlike most instruments at Lauder which passively measure incoming radiation, the radiation that’s used is actively generated inside the lidar. When showing visitors around Lauder, I’m always reminded of how impressive it is.
How does it work? The ozone lidar starts with a powerful laser “gun” that produces rapid pulses in a beam of UV-B radiation. Some of the beam is then split off and shifted to a longer wavelength, by a process called “Raman” shifting (named after its discoverer) during its passage through a gas-cell containing hydrogen gas. With the right amount of gas in the cell, some of the original UV-B radiation, which is strongly absorbed by ozone, is converted to UV-A radiation, which is only weakly absorbed by ozone. The pulses at both wavelengths are then directed up into the sky. When a “bullet of light” (i.e., a photon) within that pulse encounters a gas molecule, it is sometimes scattered back through a full 180° angle. In that case it can return along the same path and be captured by a telescope that is set up alongside the outgoing beams. The telescope then focuses the return signals on to two detectors. When the lidar was first installed, the telescope that did this was the second largest in New Zealand, but it was of no interest to astronomers because of its narrow and unchanging vertical field-of-view. It needs a narrow field of view to collect the scattered light without being swamped by other light. But its narrow field of view also means there’s a lower altitude limit, which is governed by the altitude at which the outgoing beam starts to fall within the telescope field of view.
Why is it so cool? The lidar impresses me for two reasons. Its huge vertical range - up to 90 km - and its precise vertical resolution - about 100 m. That resolution is staggering when you realise that the beam moves at the speed of light (3 x10^8 metres per second) - which corresponds to 300 metres every millionth of a second. So, to resolve altitudes to 300 m resolution, you need to be able to switch at rates measured in less than 1 millionth of a second. After each pulse is sent up from the lidar, the electronics sort the return signals into bins corresponding to time delays, measured at sub-microsecond intervals, from when the pulse was sent out. The time delay corresponds to the altitude probed, and the difference in signal strength between the UV-A and UV-B channels tells how much ozone was in the return path. This is enough information to deduce the vertical profile of ozone.

The enormous range in sensitivity that’s achieved to allow measurements to be made over such a wide range of altitudes is also quite staggering. As the altitude increases, the local pressure of the atmosphere reduces with a “scale height” of about 7.5 km, which means that for every 15 km increase in altitude, the pressure reduces by about a factor of ten. At the Earth’s surface, the pressure is about 1000 mbar.[1] So, at 15 km, it is 100 mbar, at 30 km it is 10 mbar, at 45 km it is 1 mbar, and so on. At the upper limit of the lidar’s range, near 90 km, the pressure is less than 0.001 mbar, which means the concentrations of atmospheric gases there are only one millionth of those the surface. To me, it’s incredible that these tiny reflections can still be detected after the beam has passed up and down through the much more-dense atmosphere. It reminds me of a saying in golf when you accidentally hit into a tree. Somebody invariably remarks that “it’ll be OK, they’re 90 percent air”. Similarly, the fact that a lidar beam can travel up and down through 90 km of the atmosphere with only one collision demonstrates that the space occupied by the gas molecules themselves is just a tiny fraction of the total volume. Lidars are now also used in satellite instruments, where the decreases in atmospheric pressure with altitude work for you instead of against you because the pressure is largest at the most distant point from the instrument, and the smallest reflection signals occur closest to the detector.
The Dobson Spectrometer
Despite all the advances in ozone measurement, the old Dobson spectrophotometers are still the “gold” reference standard. They too work on an ingenious principle. Like many of our measurement systems, they start by dispersing light from the sun (or sky) into the spectrum. You’ve seen an example of this dispersion when you look at a rainbow, which occurs when light from the sun passes through droplets of water suspended in the atmosphere before being reflected at the opposite surface of the droplet. The light is bent at the air-water interfaces, as you’ve probably noticed if you’ve looked into a swimming pool, where the underwater objects look bigger and in slightly the wrong place. Different wavelengths, or colours of light, are bent by different amounts. The blue end of the spectrum is bent most, and the red end is bent the least - as on the cover of the classic Pink Floyd album, “The Dark Side of the Moon”. The rainbow appears because from various parts of the sky, you are seeing light that has been bent (or refracted, to use the technical term) through slightly different angles.
In a modern spectrometer, a diffraction grating that uses the principle of interference between light paths is used to disperse light into the colours of the spectrum. But the Dobson spectrometer still uses prisms. In the earliest Dobson instruments, designed in the 1920s, the spectrum was dispersed on to a photographic plate. To derive ozone amounts, each plate had to be manually developed and analysed. A laborious and time-consuming process. But, after the development of photoelectric detectors later that decade, electronic detectors superseded the old photographic method. The spectrum is sampled at two different wavelengths in the UV-B region by allowing the dispersed light to pass through two exit slits. The shorter of these two wavelengths is more strongly absorbed by ozone, so the signal there is smaller. A mechanical blade rotates in front of the exit slits so light from one wavelength, then the other, is sequentially seen by the detector, so producing an alternating current (a/c) signal that is proportional to the amount of ozone in the atmospheric light path.
At the time the instruments were designed, it was difficult to maintain stable amplification of the signals, and the clever thing about these old instruments is that they circumvented that need by using a trick called the “null detection” method. In this, a wedge of UV absorbing glass is gradually inserted in front of the longer wavelength slit until the signals from both wavelengths become the same. In that case the a/c signal becomes zero. The instrument calibration becomes a question of finding the relationship between ozone amount and the distance the wedge is inserted, which can be pre-measured in the laboratory.
So What?
In just a few years, the ozone measurement capability at Lauder had built up to be the best available anywhere in the world. With its clean, unpolluted air, the laboratory would be in a great position to contribute to our understanding of ozone depletion and its effects.
The ozone measurements provided a much-needed means of validating satellite-derived values of ozone, which are by themselves unsuitable for the detection of trends because of potential instrument drifts. At the initiative of one of our colleagues, Greg Bodeker, we went on to develop a method to pin the satellite data to ground-based measurements and produce the “NIWA Assimilated Global Ozone” dataset, which is widely used today for trend studies. Greg later left NIWA and founded his own company, Bodeker Scientific. But he still maintains updates to the database, so it’s now called the NIWA-BS merged ozone assimilation.[2]
As well as protecting us from UV, ozone also absorbs infra-red radiation, so is a significant greenhouse gas. Nowadays at Lauder, we also measure tropospheric ozone, along with a range of other greenhouse gases. These tropospheric ozone measurements show that the amount of ozone in the air we breathe at Lauder is only half that in the northern hemisphere. That’s good because, as I noted earlier, ozone is a poisonous gas.
But there’s a downside. The smaller contribution from ozone in the lower atmosphere (troposphere) means that the total ozone amount above us is less than at similar latitudes in the northern hemisphere. There, about 10 percent of the ozone is in the troposphere, but for us it’s closer to 5. Although the overwhelming majority (90 or 95 percent respectively) is higher up in the stratosphere, our smaller tropospheric component contributes significantly to our more intense UV.
[1] In SI units, a pressure of 1000 mb corresponds to 100,000 Pascals, which more commonly expressed as 1000 hecto Pascals, hPa). In turn, that’s about the same as the pressure needed to support a 750 mm column of mercury.
[2] Greg recently told me that I shouldn’t call it an “assimilation”. That word apparently has a more specialised meaning in the atmospheric modelling community. But I still argue that specialised meaning applies only to the verbed form of the noun. A colleague, Clive Rodgers (an Oxford Don, no less) once told me that “any noun can be verbed”.
I hope that wasn’t all too technical for you. I assure you that the next chapter “Nights to Remember” will be be easier going.


