The amount of overhead ozone is important for the UV radiation we receive. If ozone goes down by 1 percent, the skin-damaging UV radiation transmitted to Earth’s surface goes up by a little more than 1 percent. That’s why there was such a clamour when the ozone hole was discovered 4 decades back.
So my interest is always piqued by papers talking about ozone trends. A new one - by my colleagues at Lauder - has just been published.
But, before I get into that, a little background info …
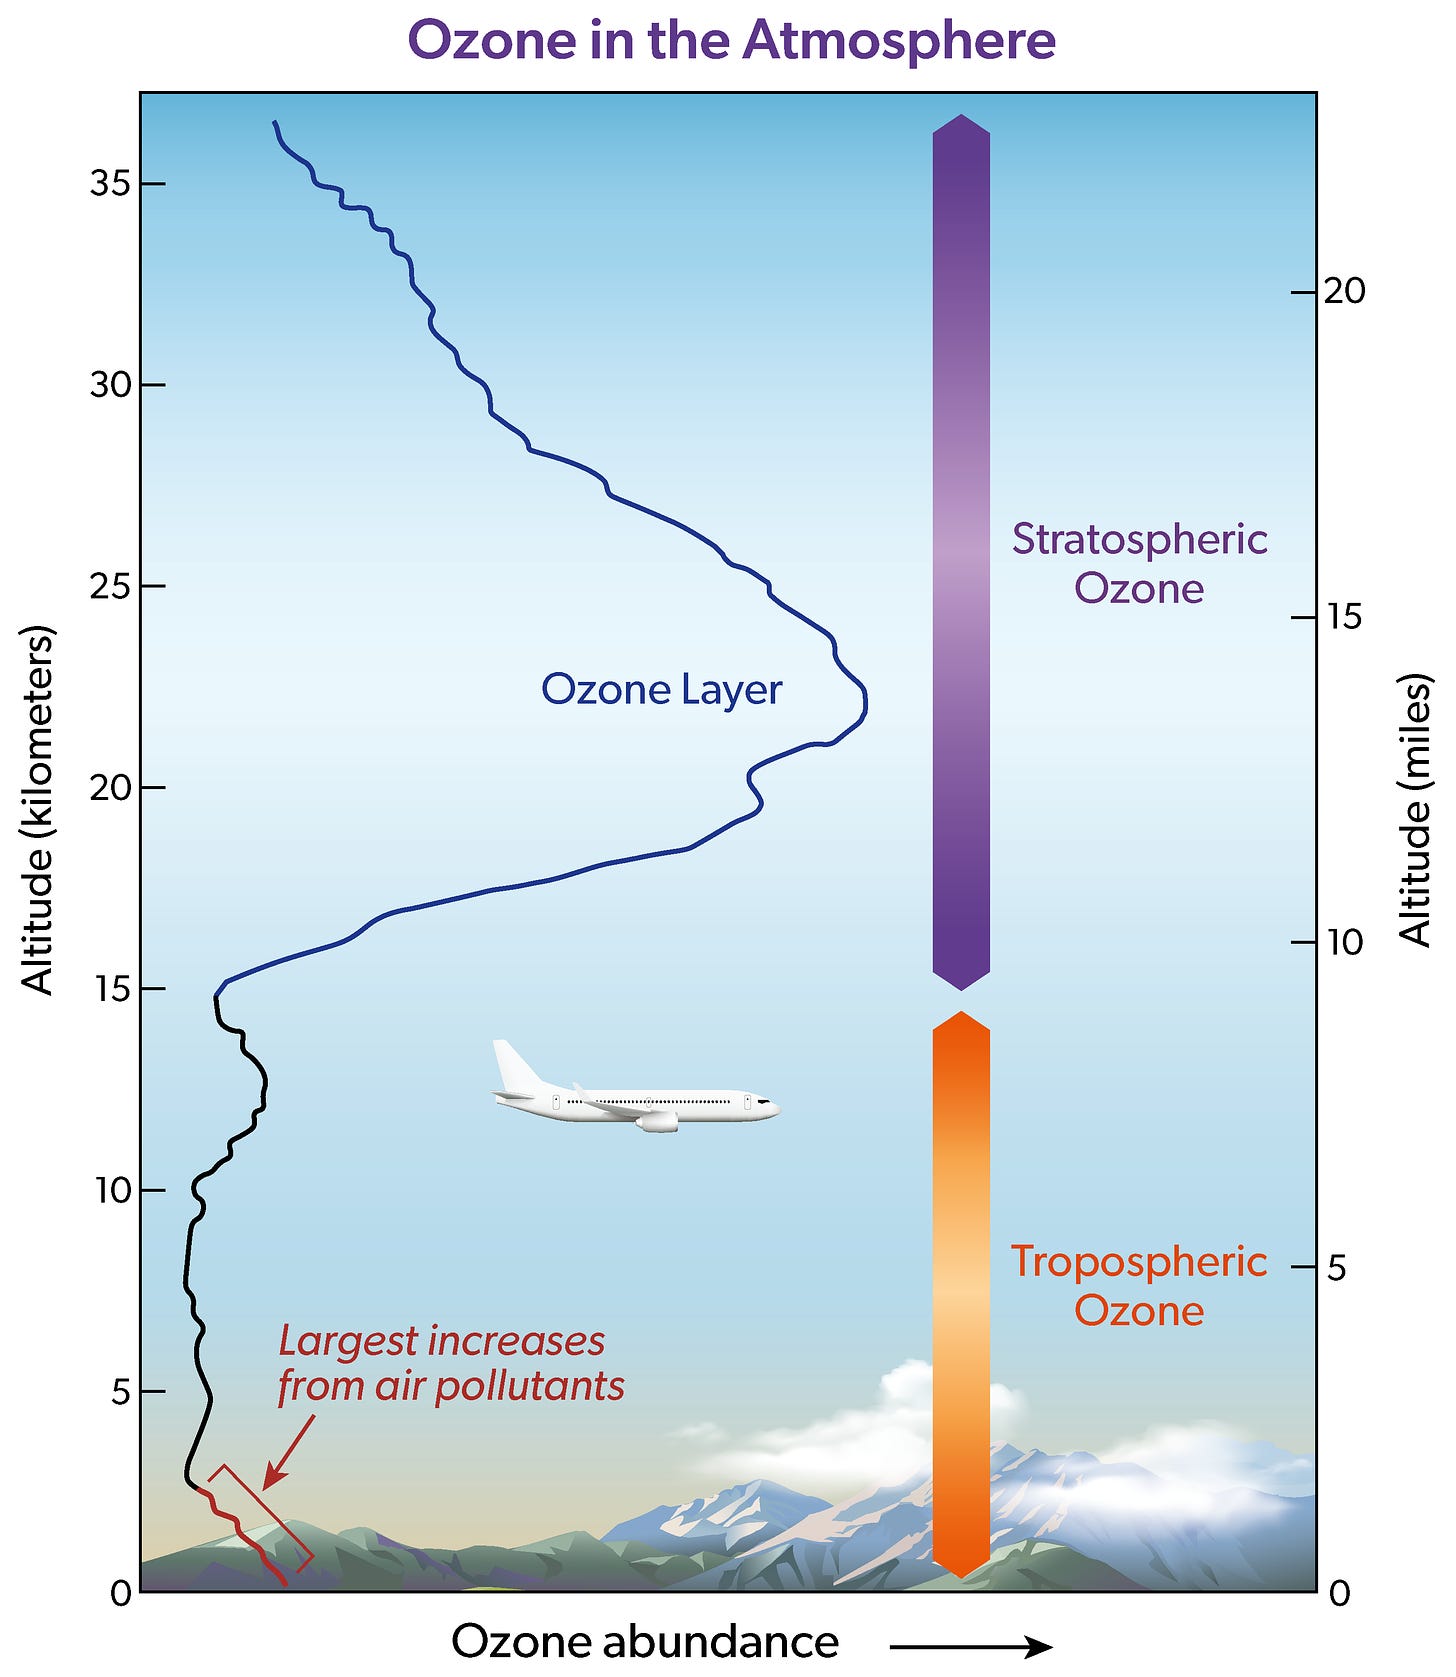
When we talk of the ‘ozone layer’ it seems to imply that there’s a thin shell of ozone up there somewhere surrounding the planet. In reality though, the ozone is distributed throughout the atmosphere, with peak concentrations occurring around 20 to 25 km above the surface, as nicely illustrated below (taken from here). The shape of that profile varies from place-to-place, seasonally and over shorter time scales.

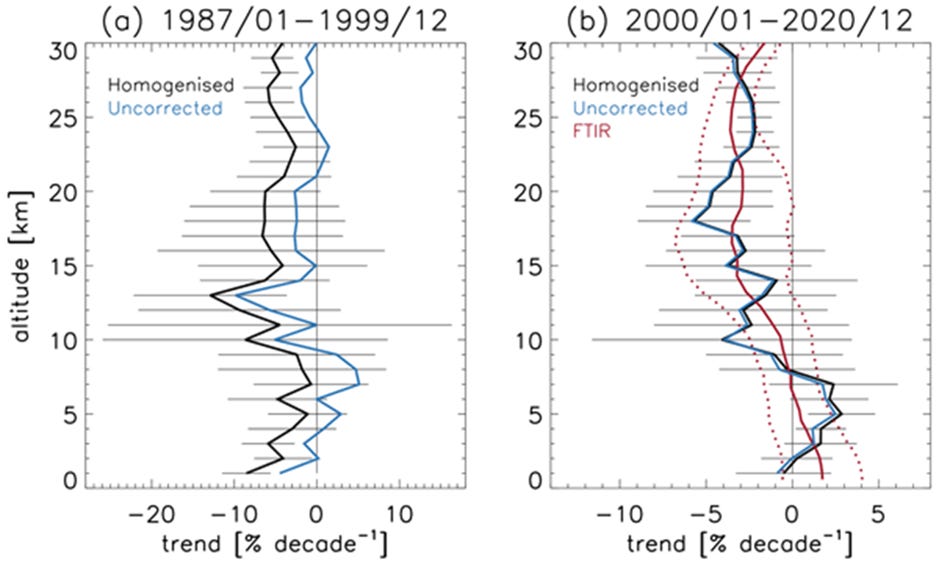
The just-published paper by my colleagues shows ozone reductions in the lower parts of those profiles, as deduced from balloon-borne measurements, over the last two decades.
Their key result is shown below, for two time periods.
The message from the left panel isn’t so clear, but the right panel shows that since the turn of the century, trends have been significantly negative at all altitudes between 17 and 30 km. We know they’re significant because those error bars don’t reach the zero line. The average change over that range of altitudes is something like 5 percent over that 20-year period.
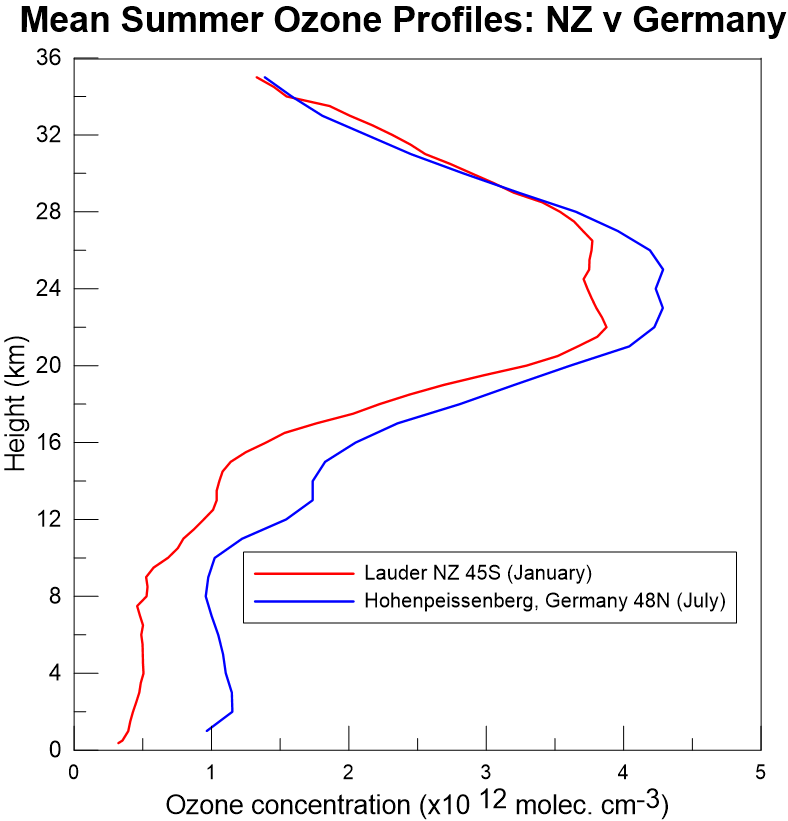
You can see from the plot below for Lauder (red curve, from here), that the 17 to 30 kilometre range in altitude accounts for the vast majority of the total ozone column.
But my colleagues also say in their paper that overall trends in ozone (from other instruments) do NOT show a negative trend. I agree with that. In fact the ozone over Lauder is recovering, and the amount of UV has decreased slightly since the turn of the century, at least in the summer months (see figure Q2.2 from here). But that leaves us with an inconsistency. I think there must be unresolved issues in at least one of the data sets.
Notice the differences in ozone between the two sites. Summer ozone amounts - which are the ones that matter for UV - are much lower in New Zealand than at a similar latitude in Germany - by at least 10 percent in this case. That’s mainly because there’s a lot less ozone in the lower atmosphere over New Zealand. An oft-repeated rule-of-thumb for ozone is that about 10 percent of the total column is in the troposphere (i.e., the region of the atmosphere below about 12 km). But that rule of thumb doesn’t apply for the unpolluted air above Lauder. There, the tropospheric burden of ozone is only 5 percent of the total. The negative trends above 17 km therefore can’t be balanced by the positive trends below 17 km.
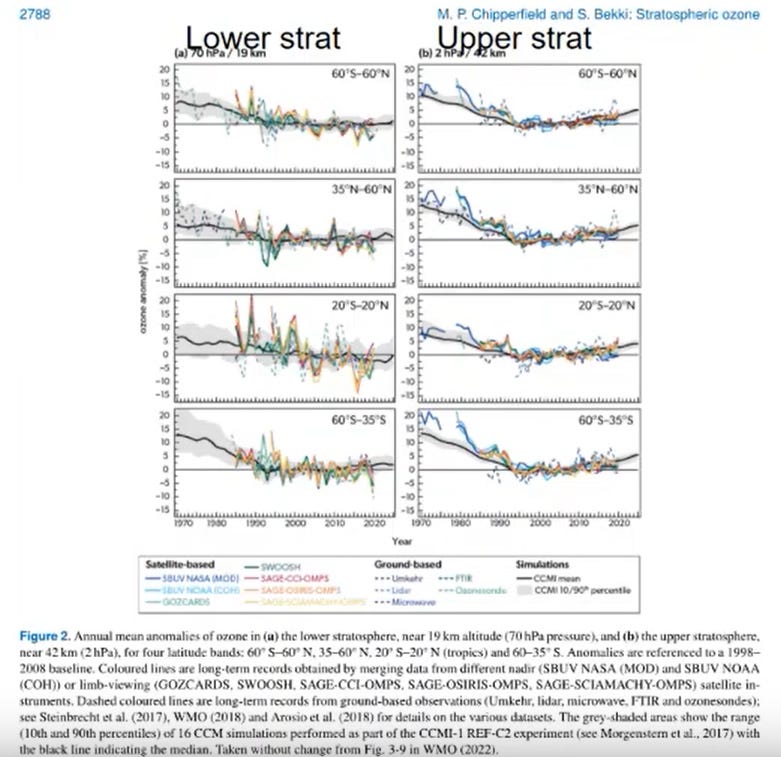
The only remaining possibility is that positive ozone trends above 30 km are the cause. We know ozone is increasing at these altitudes as you can see if you can be bothered poring over the graphs on page 2,788 of the most recent Ozone Assessment! At Lauder’s latitude (45S) those increases are smaller than 2 or 3 percent per decade. The trouble is (again) that again there’s not much ozone above 30 km. At least 90 percent of it lies below that altitude. So even an increase of 5 percent per decade at those altitudes contributes less than 0.5 percent per decade in the total column.
My colleagues’ paper is a careful and detailed analysis. It’s not ‘wrong’ either. But I don’t think it should have been published until that inconsistency was resolved. That’s what peer review is for. For example, there’s another instrument at Lauder that measures ozone profiles: the ozone LIDAR. That could have shed light on the problem, but for some reason measurements from it weren’t considered.
It’s important to get these things right. As an even more recent paper explains, the spillover of polluted air into the stratosphere may contribute to ozone increases there. Differences between the northern hemisphere and unpolluted southern hemisphere sites like Lauder will provide a good testing ground for that theory.
If you’re interested, there’s a nice write-up of that paper here. I particularly like the title: a (negative) variation of the time-worn ‘What Happens on Camp Stays on Camp’.
Anyway, the bottom line is that despite the apparent decrease in ozone my colleagues found at some altitudes, the total column is not decreasing. And that’s what matters for UV. 😊
For the geeks. In case it’s bugging you, here’s the figure I mentioned above ….


https://doi.org/10.5194/amt-16-4693-2023
Total column ozone trends from the NASA Merged Ozone time
series 1979 to 2021 showing latitude-dependent ozone recovery
dates (1994 to 1998)
Jay Herman1, Jerald Ziemke2, and Richard McPeters3