How is UV Index related to UV Dose?
A simplified version of a talk prepared for a Sun Exposure Summit in Brisbane, explaining the difference between UVI and UV dose ...
On March 16, 2020 I was supposed to give a talk at the Australian Skin and Skin Cancer Research Centre’s Sun Exposure Summit in Brisbane to explain the difference between the UV Index (UVI) and UV dose. The meeting was postponed because of the COVID-19 pandemic. The talk was targeted towards health workers, but in the meantime I’ve written it up here in a form that’s (hopefully) accessible to the public.
Updated March 15, 2021 for my presentation that day using Zoom.
Updated May 11, 2020 to add this link to video recordings of the conference presentations.This is one of my occasional posts at UV & You. Sign up for more by clicking the box below ..
What is the UVI and what’s its Relationship to UV Dose?
I guess I should start by saying the purists out there will tell me off for using the word ‘dose’ which is usually reserved for describing the amount of something that gets in, rather than the amount that’s available. But I’ll continue to use the word with that caveat because (a) that was the title I was provided for the talk (so its widely used anyway in this context), and (b) it’s much more succinct than the pedantic terms. So here I’ll use the word dose to mean the amount of energy received over some time interval, whereas the dose rate is the rate at which that energy arrives at a particular time. With that terminology, the UVI is an example of a dose rate, which is an instantaneous quantity.
If we’d just stuck with the International System of Units (i.e., the SI metric units) it would all have been very simple. In those units, the dose rate is measured in watts, named after 18th century Scottish physicist, James Watt. The watt is a measure of how fast energy arrives. On the other hand, the amount – or dose – of energy is measured in joules (J), named after 19th century English physicist James Prescott Joule. A watt is the same as a joule per second (abbreviated to 1 W = 1 J/s ).
The UVI is just a scaled measure of the irradiance or dose rate. The UV dose, on the other hand, is just the integral over time that would result from that dose rate. For example, if the dose rate was 1 watt per square metre (i.e., 1 W/m2 = 1 J/m2/s) then the dose after 1 second would be 1 J/m2. If the dose rate remained constant, after minute would be 60 J/m2, and after an hour it would be 3600 J/m2. So the corresponding amount of energy hitting a surface of area 1 square metre would be 1, 60, and 3600 joules respectively.
Unfortunately we don’t always use SI units, especially when dealing with energy. In fact my guess is that most non-scientists have never heard of a joule. The diversion from SI units is mainly because the numbers are inconveniently large or small, so we use some scaled versions to make them more digestible.
The problem is illustrated by the spectra pictured below and the corresponding Table of doses and dose rates calculated from them.
Solar spectral irradiance outside the Earth’s surface, and the mean noon spectrum at the Earths’ surface for the contiguous USA (calculated to evaluate the output of solar PV systems).
I’ve drawn broken vertical lines to sub-divide the spectra it into their components of UV (UV-C, UV-B, UV-A), visible, and infra-red (IR). The visible portion of the spectrum is also highlighted with the corresponding colours of the rainbow for each wavelength.
The radiant power - or dose rate - within each band is the integral over that wavelength range. That’s the same as the area under the curves and is measured in watts per square metre (W/m2).
By comparing those areas, it can easily be seen that the total power at visible wavelengths is less than 50 percent of the total (i.e., the coloured area is less than the grey area). The infra-red component of sunlight is more than 50 percent of the total, whereas the UV component is small, with only a tiny portion in the UV-B region. The UV-C component is strongly absorbed by atmospheric ozone and oxygen, and none reaches the Earth’s surface.
The table below shows the irradiances (dose rates) and doses in SI units calculated for various spectral intervals. The problem is immediately obvious in the large numbers in the first line of the table. They’re just too large for public consumption.
You’re probably already familiar with the usual solution for electric power and energy, where kilowatts and kilowatt-hours are used instead. In the first line of the table, instead of giving the energy dose from the sun in 1 hour as 3,600,000 J/m2, it’s expressed as 1 kilowatt-hour. Smaller by a factor of 1000 for kilowatts and by another factor of 3600 (i.e., 60 x 60) for hours rather than seconds. Much more digestible numbers. The kilowatt-hour in turn is more colloquially simply called a “unit”.
It’s the dose, rather than the dose rate that usually matters. When you turn on your 1 bar 1000 W electric heater for an hour, that will use 1 unit of energy. At the end of the month you’ll be billed for that amount of energy. There won’t be any reference to whether it was two bars for half an hour, or one bar for an hour. The cost for that unit of energy will still be the same: about 25 cents in New Zealand. It’s the dose that matters for UV damage too.
The next few lines of the table are for various other spectral intervals. The last of these is the sun-burning irradiance, also called the erythemally-weighted irradiance (UV_Ery), which is is the most relevant here. The biological weighting function for erythema is normalised to 1 for wavelengths up to 297 nm, and then decreases rapidly through the UV-B and UV-A regions, essentially reaching zero near 400 nm (as shown in the figure above). For normal conditions UV_Ery is about 1/7th of the UV-B irradiance (i.e., integrated from 280 to 315 nm). For this reference spectrum UV_Ery is only 0.01% of the total energy. For public consumption, the amounts in SI units is an inconveniently small number (e.g., UV_Ery = 0.1 W/m2 for this spectrum), but the doses are still inconveniently large (320 J/m2).
For historical reasons, we departed from SI units when describing sunburning UV. Instead of simply reporting it in W/m2, we adopted a new unit called the UV Index (UVI), which is just UV_Ery multiplied by 40. The scaling factor of 40 was to give a maximum at the US-Canada border of UVI=10 (corresponding to 0.25 W/m2 of erythemally-weighted UV).
Outside Earth’s atmosphere the UVI would be about 300. But at the Earth’s surface, its hugely reduced, mainly because of absorptions by atmospheric ozone. At the US-Canada border it can be 3 times larger and in New Zealand and Australia the UVI can exceed 14 and 16 respectively. Its largest measured anywhere at the Earth’s surface is about UVI = 25 (at high altitude near the equator).
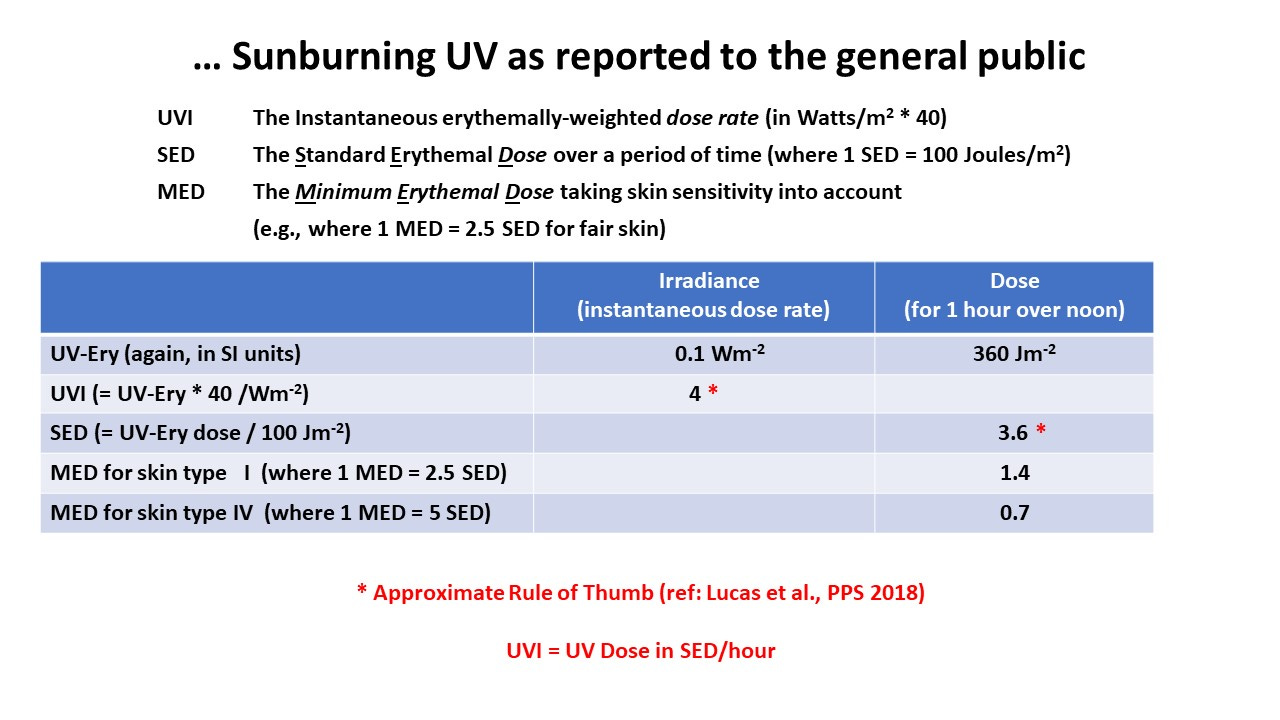
The slide below focusses just on the erythemally weighted UV (i.e. sunburning UV), but as it’s reported to the public, rather than in strict SI units. For this reference spectrum at Earth’s surface, the UVI would be about 3.5 (but I’ve rounded it 4 for simplicity). That’s rather moderate value.
At the US-Canada border it can be nearly 3 times larger, and in New Zealand and Australia the UVI can exceed 14 and 17 respectively. Its largest value anywhere at the Earth’s surface is about UVI = 25 (at high altitudes near the equator).
The dose is also expressed in non-SI units. Instead of just expressing it in J/m2, we define a “Standard Erythemal Dose” (SED) as 100 J/m2, and express the dose in terms of these SEDs. So 1 SED is just 1/100th of the dose in J/m2. Instead of 360 J/m2 for the standard spectrum, it reduces to 3.6 SED.
The two numbers in red are similar. I’ve highlighted them to reinforce a results from our 2018 study which show that, to a reasonable approximation, the UVI is about the same as the number of SED per hour (assuming the UVI doesn’t change over that hour).
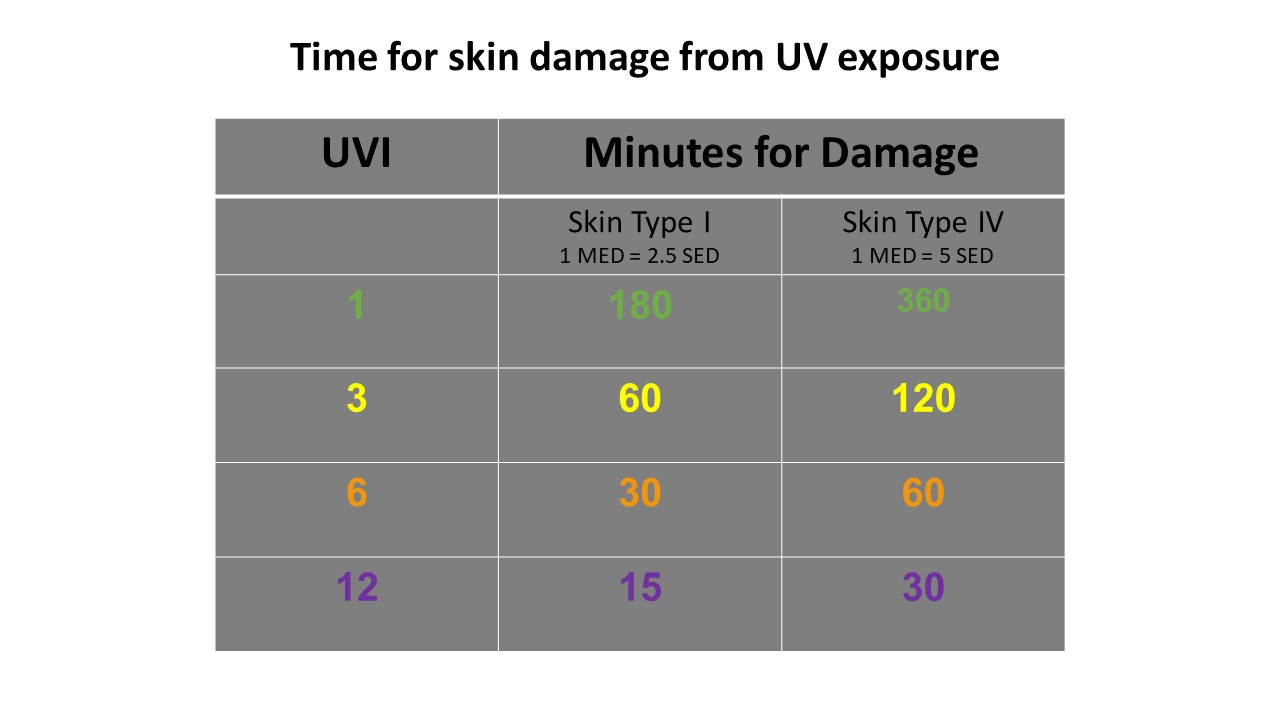
Just as for our power bills, skin damage from sunlight will usually (within limits) depend on the total dose (the amount of energy, in Joules), rather than the dose rates (in Watts). So the damage from UVI = 12 for 15 minutes would be same as from UVI = 6 for 30 minutes, or from UVI = 3 for 60 minutes, etc. But there are limits to this “reciprocity” between dose rate and time. For example, reciprocity hasn’t been tested for UVI < 3, and for such low values it’s possible that repair mechanisms act fast enough to keep up with skin damage.
But to complicate matters even more, different people have different sensitivities to UV damage. In recognition of this, yet another unit is introduced to specify damage to human skin. It’s called the “Minimum Erythemal Dose” (MED), which varies with skin type. Two examples are shown in the table. For example, for the most sensitive skins (Type I) I MED =2.5 SED = 250 J/m2, whereas for darker skin (Type IV), 1 MED = 5 SED = 500 J/m2.
For skin type I, visible damage (in the form of erythema – skin reddening) occurs for UVI = 12 after an exposure time of about 15 minutes. Therefore, for UVI = 3 damage would be seen after an exposure time of about 60 minutes. That’s important. Currently we recommend that “no protection is required” when the UVI is less than 3. In truth, skin damage can occur within 1 hour when the UVI = 3. With that threshold, it’s implied that no protection would be required for many months of the year, even in New Zealand and Australia.
For protection against UV damage, some health agencies state:
Protection is required when the UVI is greater than 3 (implying, and sometimes stating explicitly, that no protection is required when the UVI is less than 3)
Avoid getting sunburnt.
There is a serious inconsistency between those two public advisory messages.As we pointed out in 2018, skin-damaging doses of UV can frequently occur on days when the UVI remains below 3. In fact several skin-damaging doses can occur.
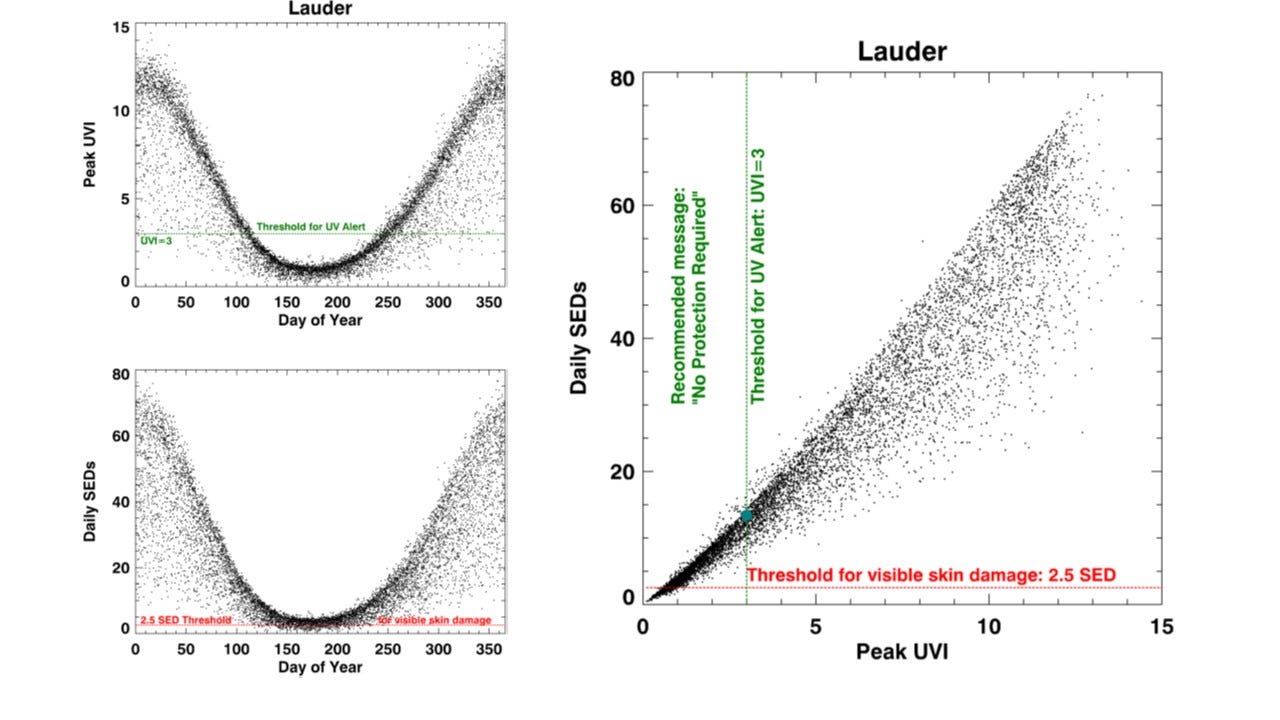
Below I’ve shown the peak daily UVI and daily dose (in SEDs) as a function of day of year for several years of data at Lauder, New Zealand (45S). It shows that there are many days for which the peak UVI is less than 3, yet the daily dose exceeds 2.5 SED. In fact, the daily dose can sometimes exceed 15 SED on days when the UVI remains less than 3. That’s enough to cause damage to even the darkest skin types.
Relationship between the peak daily UVI and daily dose (in SED) at Lauder, NZ
The problem we identified isn’t confined to New Zealand’s latitudes. Shown below are similar comparisons for 4 other sites, including two in Australia. The faulty advice is less of an issue at the low latitude sites where the peak UVI usually exceeds 3.
Relationship between the peak daily UVI and daily dose (in SED) at 4 other sites
In conclusion, the following points are noted:
Sun protection messages should not imply that no protection is needed on days when the peak UVI is less than 3.
That’s true only if the exposure time is less than 1 hour.
Protection may be required for exposure times greater than 1 hour.
Severe damage for most skin types can occur on such days during activities like golf, where the outdoor exposure period can exceed 3 hours.
For such activities, damage can occur for sensitive skins even on days when the peak UVI is less than 1.
Skin damage depends on the dose and skin type (rather than just the peak UVI).
It therefore depends also on the outdoor exposure period.


