I’ve been putting this one off, and I’m glad I did because it’s getting interesting …
The difference between a weather-forecaster and a climate-scientist like me, is the scale of time involved. If weather-forecasters get it wrong, they’ll hear about it. It’s much more comfortable for climate scientists. Our predictions are long forgotten before the event’s occurrence or non-occurrence comes to pass.
Then there’s an in-between period of forecasts/predictions for weeks or months into the future - like the prediction of how big the springtime Antarctic ozone hole will be. Those predictions contain a bit of both. Climate scientists told us to expect a larger and persistent ozone hole this spring because of reactions that would occur in the presence of large amounts of water vapour from the Tongan eruption (which took more than a year to penetrate to Antarctic latitudes). But the weather also plays a part.
Sometimes, the ozone hole remains symmetric well into November, leading to persistent ozone depletion within its confines. But occasionally, the region of ozone depletion gets distorted by winds, and becomes vulnerable to the intrusion of warmer ozone-rich air from lower latitudes. Previous years where this has happened include 2002 and 2019 when the area of the hole (upper plot below) was less than half that in surrounding years (but still larger than the area of Australia!), and the minimum ozone amount remained above 150 DU (lower plot), about 50 DU greater than in nearby years. Overall, the ozone holes seem to be gradually diminishing in severity each year since their peak in the decade around the turn of the century.

This spring, Antarctic ozone depletion was stronger than usual - but not dramatically so - early on, as shown in the plots below, which are taken from the excellent NASA Ozone Watch website. The grey area is the range of values each year since 1979 when the ozone hole was just starting to form.
From these plots, the worst seems to be over for this year.
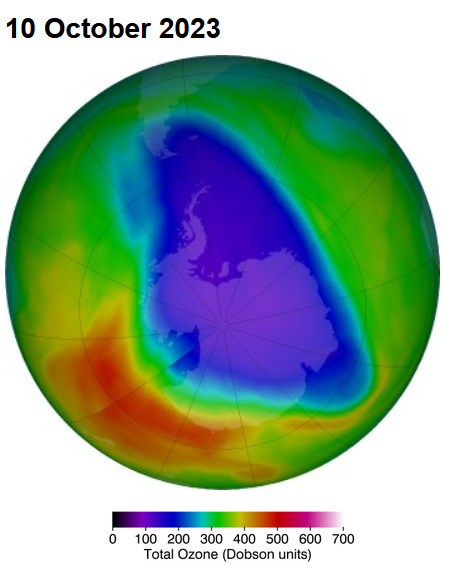
The ‘false colour’ map below, centred on the South Pole and extending to mid-latitudes shows how the ozone hole looked on 25 Sept, which is close to the usual peak date. In these maps, higher ozone amounts are shown in orange and red, while lower amounts are shown in blue and purple. The threshold for an ozone hole is taken as ozone being less than 220 DU
The map from 5 days later showed a bit more distortion in the field. It also showed that no place had more ozone overhead than New Zealand (just discernible at bottom left on the image).
By last weekend, the beginnings of the breakup in the hole could be seen, as shown in the map below ….
Although the ozone hole had diminished in size compared with late September, those intrusions of low ozone extending to mid-latitudes are concerning. To my knowledge this is the largest such low-ozone overspill ever seen and includes ozone values of 250 DU or less extending to mid-latitudes over South America. I think we haven’t heard the last of that!
There was low ozone over the South Pacific Ocean too. But those sharp changes at the bottom left of the map need to be taken with a grain of salt. Over the 24-hour period represented, there must have been large variations in ozone, which led to a large discontinuity at longitude 180 (just to the east of New Zealand). New Zealand is still under the ridge of high ozone, but those lower ozone amounts to the south are getting uncomfortably close. No cause for panic - the amounts of ozone in that tongue of ozone-poor air are no less than those that occur naturally over New Zealand in the late summer. But it’s a timely reminder to get those sunscreens out early this summer.
As you can see from that tongue of low ozone (blue) extending over South America, ozone losses have already been seen over populated areas, leading to appreciable increases in UV. According to the GlobalUV app, the UVI about then in northern New Zealand (Kaitaia) reached only 7, whereas at corresponding latitudes in South America (Buenos Aires and Santiago) it was nearly 30 percent more (UVI = 9).
Perhaps those predictions of enhanced ozone depletion due to water vapour from the Tongan eruption were correct in some sense at least. Although the ozone hole wasn’t particularly large or deep this year, its effects are being seen over a much wider range of latitudes. Its continued persistence in the weeks ahead would be more damaging because of the increasingly higher sun-elevation angles, which also contribute to higher UV levels. Fortunately, the break-up looks to have started already. We can’t yet be sure, but the elongation of the ozone hole in the most recent ozone map (below) suggests that the end is nigh for this year’s hole …
As you can see, New Zealand is still safely under that ridge of high ozone. Our peak UVI currently ranges from 5 in the deep south, up to 8 in the far north (where peak sun elevation angles are about 12 degrees higher). The UVI will increase rapidly as we go into summer, due mainly to the increasingly high sun elevation angles at noon.
It’s time to slip, slop, slap.
You can keep an eye on UVI developments with the free UVNZ or GlobalUV smartphone apps.


