Water vapour kills ozone?
No big deal (this time), or maybe not ? Time will tell...
Before I start … See the update to my previous post. It goes some way towards explaining my confusion about the figure showing peak UVI. Thanks Zim!
[Download the Substack App to see archives of posts, including any updates.]
Another old UV colleague, Petteri Taalas, originally from Finland, has risen to the dizzy height of Secretary- General of the WMO. He’s raised the stakes of UV by including the topic in an updated title of their regular reports. Well done. Hopefully that will go some way towards stopping this important subject falling off the radar completely. The first issue of this new “WMO OZONE AND UV BULLETIN” can be found here.
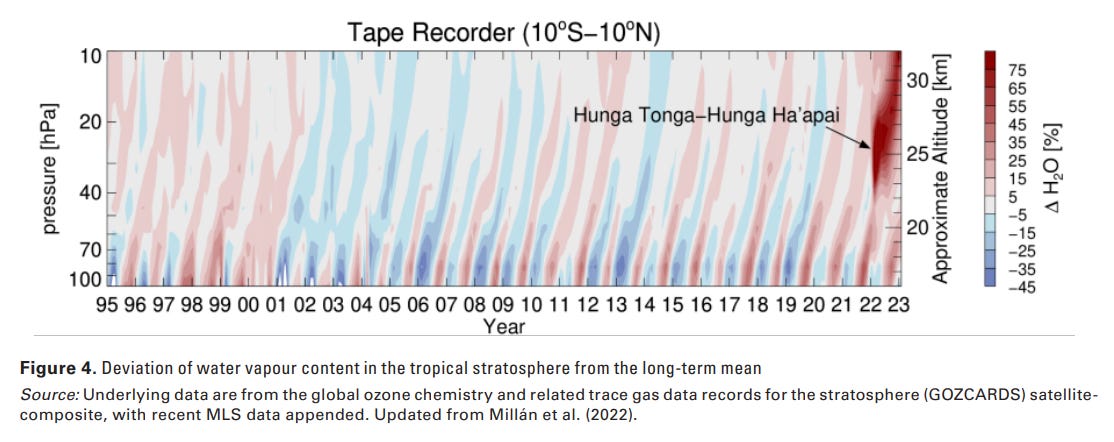
It includes the aptly-named ‘Tape Recorder’ plot below, which shows how the recent eruption Tongan volcano had an unprecedented effect on the amount of water vapour present high in the atmosphere.
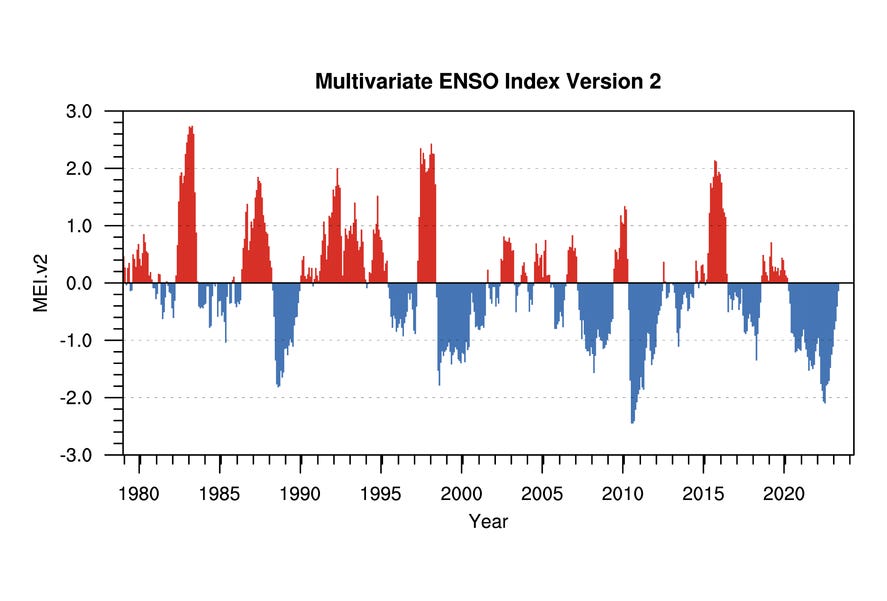
I wondered what caused the other long term changes, like the wetter period (red shading) around the turn of the century and the drier period early in this century (blue shading). It’s well known that variations in ocean temperature can affect the stratosphere. The most important of these is the quasi periodic switching of the so-called ENSO index: a number associated with switching between the El Niño and the opposite La Niña phase of the Southern Oscillation. It’s effects are largest in the Southern Pacific.
A plot of the ENSO index is shown below. Comparing it with the one above, it’s immediately obvious that those historical periods of increased water vapour are associated with negative values of the ENSO index, and periods of decreased water vapour are associated with positive values of the ENSO index. This means that the stratosphere tends to be wetter during La Niña events and drier during El Niño periods.
Those changes in water vapour are caused by changes in ocean temperatures, which in turn drive changes in atmospheric circulation (dynamics). In the plots, where the measurements are derived from satellite measurements, you can see the perturbation propagating upwards. It takes a year or two to propagate from 15 to 30 km (it’s more difficult to probe lower altitudes because of cloud and rain effects).
We’re just coming out of a long La Niña period that began before the Tongan eruption. So, at the time of the eruption, larger amounts of water vapour were already present. But the concentration increased by another order of magnitude after the eruption.
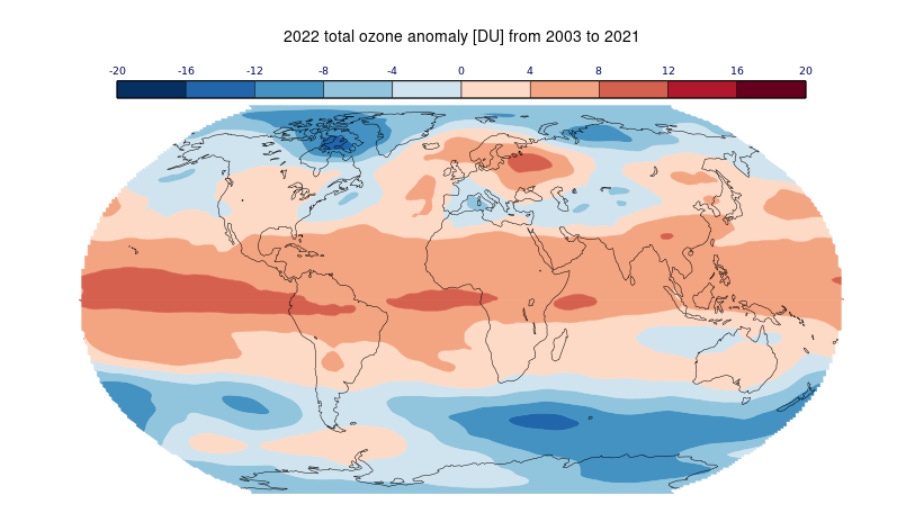
The article make the point that the relatively low ozone amounts seen in the Southern hemisphere in 2022, as shown below, may be attributable to water from the volcano. Transient ozone depletion was recently reported within the volcanic plume, but globally, any effects seem quite small.
It’s not particularly convincing. And, as I’ve discussed previously, those savage Australian bushfires from 2020 may also still be playing a part. But I wonder if it’s neither of these two effects.
The largest negative ozone anomalies (lower ozone amounts) occur at higher latitudes in both hemispheres, including New Zealand, where the ozone in 2022 was lower by about 8 DU. To put that in perspective, that represents less than 3 percent of the total ozone column - so any health effects arising from UV increases due to those ozone reductions will be negligible.
Globally, the negative ozone anomalies at higher latitudes are largely balanced by positive anomalies (higher ozone amounts) at tropical latitudes. Given that half the area of planet Earth is equator-ward of latitude 30 degrees, it appears that the total amount of ozone in 2022 may even have exceeded that over the period 2002 to 2021. Its certainly not an outlier year, as you can see in their Figure 3.
I’m probably brooking controversy among my colleagues, but to me this redistribution of ozone, rather than an overall loss of ozone suggests a dynamical effect possibly driven by ENSO, rather than a chemical effect driven by the volcano or bushfires. If it were truly a chemical effect alone, then I’d expect the overall ozone amount to decrease, rather than just being re-distributed. I should perhaps add the caveat that it’s conceivable that temperature changes induced by either the eruption or the bushfire could also lead to changes in dynamics without affecting chemistry.
There is at least one fly in the ointment though. The map above showed ozone anomalies from last year (2022). The most recent measurements in Antarctica show unusually low ozone amounts in the stratosphere. For example, on 14 July, the lowest value there was less than 196 DU, a record low for that time of year. Some of my illustrious colleagues put that down to material from the eruption finally making its way down to those southern latitudes - and they’re hypothesizing that this year’s Antarctic ozone hole could therefore be much larger than usual.
Time will tell … You can keep an eye on developments here.


