


What does the future hold for UV?
The burning question on everybody's lips ...
This is the final post in my series elaborating on slides from my talk in Brisbane last year. I thought I’d finished, but forgot this one, which had to wait until a paper that was in press at the time had finally been published.
But before going there, I need to go back a step …
Changes in ozone are one of the main drivers of changes in UV radiation. I was a contributor to the Twenty Questions and Answers document in the most recent Ozone Assessment. On page 67 of that document, past changes and projected future changes in ozone were illustrated as below.
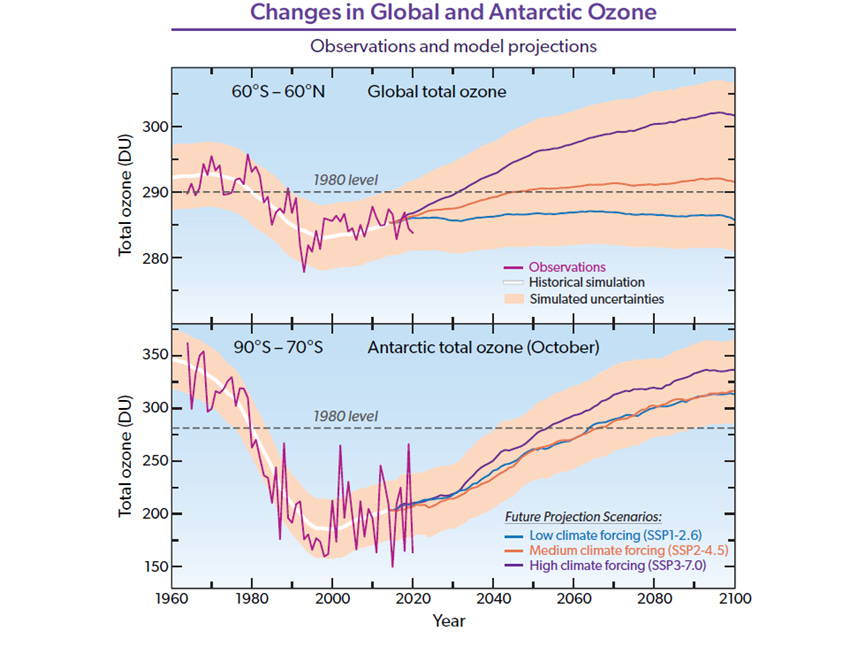
The upper panel shows the ‘global’ mean ozone. Actually, it’s not quite the full globe. Only the portion between 60°S and 60°N. But that represents about 87 percent of the world’s area, and more than 99.8 percent of its population. Over this region where people live, the observed mean ozone changes since 1960 (when a world-wide ozone-measuring network was established) have been smaller than about 3 percent. Over that same period, results from model calculations (white line) show similar changes, though year-to-year differences are not captured by the model. The unusually low ozone values in the early 1990s were due to reactions on aerosols injected into the atmosphere following the eruption of Mount Pinatubo in 1991.
The future for ozone depends on how we respond to the Climate Change crisis. The three curves at right correspond to three possible pathways. As you can see, there are differences in future ozone levels that depend on our future emissions of greenhouse gases. Lack of knowledge about that pathway represents our largest uncertainty in future ozone levels. With the highest climate forcing scenario (labelled SSP3-7.0), which is unfortunately the closest to our current pathway, a (small) super-recovery in ozone above the levels present in 1980 is expected by the end of the century. A small silver lining for the survivors of Climate Change.
The lower plot shows corresponding changes for the Antarctic Spring, which corresponds to the ‘Ozone Hole’ period. There, the changes are much larger. But the overall patterns are the same, except that by the middle of the 21st century, a super-recovery is expected for all three climate-change scenarios.
But the burning question on everyone’s lips (pun intended), is “what does this all mean for UV levels?” As usual, accurate predictions - especially for the future 😊 - are very difficult, especially for mere measurement scientists like me. The past is much easier. For the future we have to rely on model calculations. The role there for measurement scientists like me is limited to validating those models.
Measurements have confirmed that in the Antarctic spring, those large reductions in ozone have sometimes led to more than a trebling of the UVI. Outside of Antarctica though (where everybody lives), any changes in UV caused by past changes in ozone are much more moderate: generally less than 5 percent. Those, and the small projected increases in future ozone, attest to the success of the Montreal Protocol on Protection of the Ozone Layer.
But ozone isn’t the only factor influencing UV radiation. It’s also affected by changes in clouds, aerosols, and reflections from underlying surfaces (albedo). All of these are expected to change in the future, because of climate change and measures to mitigate it.
An attempt to predict changes in UV, taking all these factors into account has just been published, using models that had been shown to give good agreement with past measurements. The changes in UV were calculated for the entire globe over two periods:
The main period of ozone decline: from 1960 to 2000, and
The much longer period from 1960 to 2100, including the next 75 years.
Their calculations include estimates of changes in the annual mean and monthly mean UV Index. My colleague Alkis Bias was one of the authors, and he kindly provided me a figure in advance of the publication, for use in my talk. The relevant slide is reproduced below. It shows the percentage change in UVI for the month of April (so excludes dramatic effects of the Antarctic ozone hole) over those two periods. Other figures in the paper show the changes for other seasons and the contribution from each contributing factor (ozone, clouds, aerosol, and albedo).

The earlier period (1960 to 2000) is shown at the left. Apart from the redctions in UVI over Asia due mainly to the buildup of aerosols from pollution, it shows percentage increases in UVI becoming larger at higher latitudes where ozone reductions were most severe. Smaller increases at some higher-latitude sites arise because of increased cloud cover.
The three panels at right show the corresponding changes from 1960 to 2100 for three climate-change projection scenarios. Unfortunately, only one of the three scenarios is the same as in the first figure above. On our current trajectory, the upper and lower scenarios look less likely. But we really don’t know what path we’ll take in the longer term. Which means that we can’t be confident about the future UV.
If something like the current trajectory persists for the next 75 years (centre panel), then by the end of the century UVI levels for April will be a few percent smaller at most locations than they were in 1960. At higher latitudes (where the UV is already too low for optimal vitamin D production) it could decrease by 20 percent or more. On the other hand, near the equator (where the UV is already too high for optimal skin health) it could increase slightly. Fortunately, the largest projected increases are over unpopulated oceanic regions.
These calculations don’t include possible effects from geoengineering, or newly postulated possible decreases in ozone due to the breakdown of materials during re-entry of dying satellites.
But the future for UV does look quite hopeful. Even taking those latter two into account, it appears that UV levels won’t increase hugely under any likely scenario and are more likely to decrease slightly. Our future skin health will therefore depend more on our behavioural decisions than on changes in the atmosphere. Simple sun-smart choices will continue to be the best measures to reduce your risk of developing skin cancer.
I think we can call it a good news story to (belatedly) bring in the new year 😊.
Richard,
Very interesting! Nelson