Hi everyone. Welcome to 2023. A month has gone by already. Scary.
A recent paper by colleagues Ross Salawitch and Laura McBride on the topic of wildfires and ozone widely cited one involving our own group at Lauder that was published last year. Both of them attempt to explain how the low ozone amounts seen at mid-southern latitudes in 2020 may have been caused by the fierce Australian wildfires in the summer of 2019-2020. The ferocity of the fires pushed large amounts of ash and soot high into the stratosphere. Chemical reactions on the surfaces of those deposits accelerated the normal rates of ozone depletion, so shifting the balance to lower ozone amounts.
Were the effects seen as far away as southern New Zealand?
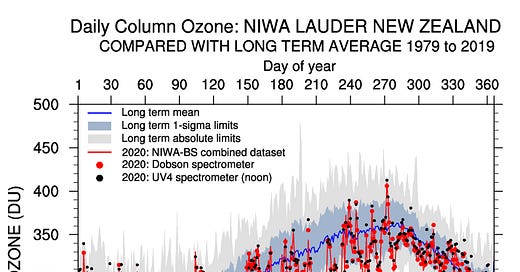
The plots below are the end-of-year versions for the last 4 years of the daily ozone plots for Lauder (latitude 45 S) which are updated daily on the NIWA ozone and UV web site (thanks to colleagues Hisako Shiona and Richard Querel for making these available). Daily ozone measurements for the year (red line, and symbols) are compared with the averages from all previous years (blue line), along with the range of measurements for each day of the year (grey shading). They all show the usual seasonal variability in ozone, with a spring maximum and an autumn minimum. Since long-term changes in ozone have been small at this site, we expect that in a ‘normal’ year, the red and blue lines should roughly overlap, and the number of individual data points below the blue line should roughly match the number above, as they do in the plot below for 2019, the year before the fires.
But, as you can see below, that’s not the case for 2020. It suggest that the effects of those Australian bushfires may have covered a wide enough range of latitudes and altitudes to show up in total column ozone amounts as far south as Lauder New Zealand. Effects were largest in the winter (especially in July and August).
But the corresponding plot from the next year (2021) shows that even lower ozone amounts - albeit more sporadic - were also experienced in New Zealand the following winter.
In the year just finished (2022), ozone amounts were more uniformly low - but without the extremes from the previous two years - from early February to mid November. As I’ve mentioned before, we think that some of that can be attributed to the effects of the Tongan eruption.
Overall, ozone amounts at Lauder have been lower than the long term mean for each of the last three years. It raises the question: are we moving to a new normal, with lower ozone amounts? As Ross said, these Wildfire effects could be a ‘game changer’ for future ozone amounts: at least for the next few decades ahead while levels of atmospheric chlorine remain elevated compared with their natural levels.
But maybe not …
Neither of the above theories (bushfires or volcanoes) explain the low ozone amounts in the winter of 2021, which reminds us that we need to be careful about interpreting the data. There’s another possible explanation. Ozone amounts are also affected by the so-called El Niño Southern Oscillation (ENSO) cycle, which oscillates between an El Niño and La Niña phase with an irregular peridiocity of a few years. These changes significantly influence patterns of air circulation in the Pacific region, and we have previously seen their effects on the amounts of trace gases measured in the ozone layer.
It just happens that these last three years have all been La Niña years. One of the effects of this phase seen in New Zealand is a southerly shift in anticyclonic weather systems. These regions of high pressure push up to make the stratosphere thinner, which reduces ozone amounts. It’s an example of Murphy’s Law. High pressures bring warm sunny weather. Great for outdoor activities. But the lower ozone amounts mean that these are the very days we need to be most careful about because of high UV amounts. Bad news for us, but good news for sunscreen manufacturers.
It’s unusual to have three consecutive years with the same ENSO phase, so we’re expecting a switch from the La Niña to the El Niño phase this year. If that happens, we should soon have a better idea of whether it’s the La Niña or the Wildfires that are causing the low ozone anomalies, especially in winter (thankfully for our UV risk). Let’s hope there are no more volcanic eruptions to further complicate things.
Parting shot: The NIWA web pages show, the La Niña phase we’re currently in is also associated with wetter weather in the north and east of New Zealand. Both received record rainfall this summer (aided and abetted by Climate Change), with disastrous consequences. Kiwis living in those sodden areas will be hanging out for that phase switch.


