Hot Water
The "smoking gun" for climate change ...
Climate skeptics often question whether the observed increase in global air temperature is correct. For example, could there be a heat island effect near cities? Are the measurement sites truly representative of larger geographical areas?
Data from a series of submersible deep water ocean buoys allay those doubts. Oceans cover 70 percent of Planet Earth’s area, and the thermal mass of water in them far exceeds that of the air in our atmosphere. Changes in ocean heat content therefore provide a much more direct measure of global warming.
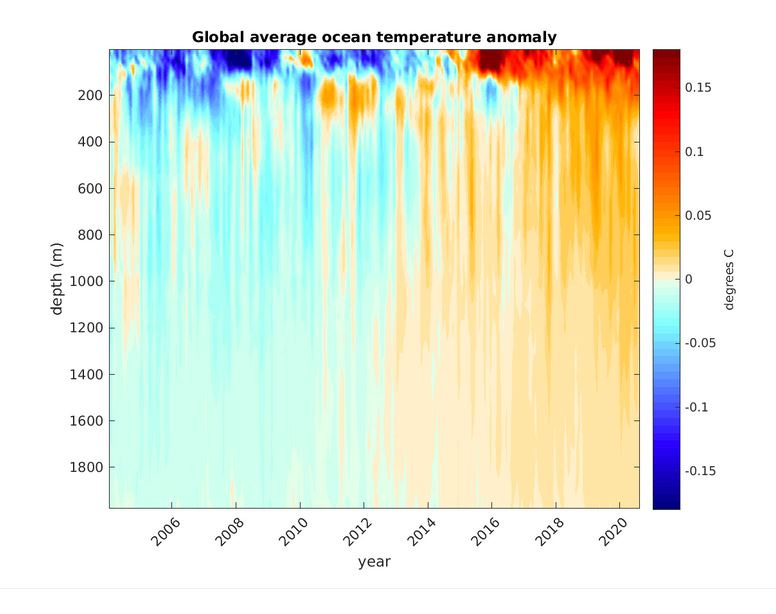
Since the turn of the century, nearly 4000 submersible buoys have been deployed to do just that, as part of a huge international project called ARGO. My old employer (NIWA) has played a significant role deploying them in this part of the world. They confirm that temperatures throughout the oceans are indeed increasing, just as for air.
In the last 20 years, these drifting buoys have yielded over two million profiles of temperature in the water column down to depths of 2 km. Data are transmitted to satellites for archival during short periods at the surface, and are unencumbered by daily variability and localised effects.
Even though the data record is still rather short, the results are unequivocal. Temperatures are increasing throughout the upper 2000 m of the world’s oceans, with largest changes near the surface. And the observed rate of increase at the surface is even faster than predicted in the most recent IPCC Assessment.
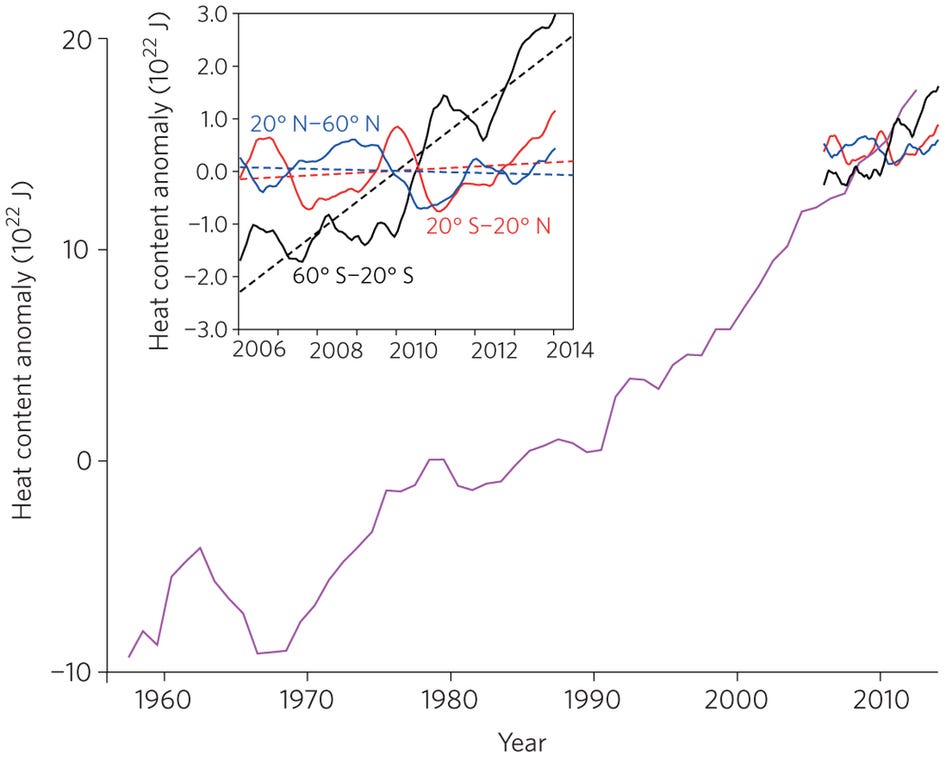
But how do we know that we’re to blame? From the temperature changes with depth, it’s possible to calculate the increase in energy stored in the oceans, and to compare it with that predicted from climate models. These models include calculation of the increased trapping of outgoing radiation caused by the increased concentrations of greenhouse gases like carbon dioxide that we’ve caused. The results are reproduced below.
The measured increase in stored energy is huge but a bit smaller than predicted, possibly because of the limited depth range available. New versions of the ARGO buoys that can descend to 6 km are now being deployed.
The agreement between observed and calculated changes in oceanic heat content is the game-breaking “Smoking Gun” result noted in my book. It shows that the planet is warming because of mankind’s increased emissions of greenhouse gases. It’s just as convincing as the equivalent “Smoking Gun” result from ozone research, which demonstrated an almost perfect anti-correlation between chlorine and ozone in the atmosphere above Antarctica, proving that chlorine from CFCs was to blame.
Thanks for listening. Click below to join the club for occasional free updates about UV, Health and Climate


Hi Richard,
Few if any serious and competent scientists deny the anthropogenic factor. The observed effect of CFC’s on ozone is quite credible but I do not see good correlation between observed and calculated changes in oceanic heat content. Only the heat content anomaly for the region from 60 degrees south to 20 degrees south shows some correspondence with the model and an aggregate factor for three ocean regions is very much smaller than predicted.
Climate models cannot determine cause-effect relationships except when all credible variables have been tested in non-linear, multiple regression analysis and I have never seen anyone publish something like this. My research indicates that increasing land and ocean surface temperatures are mainly caused by human destruction of natural vegetation which has been massive, progressive and still on-going. Natural vegetation absorbs and stores solar energy and carbon dioxide, stores heat, cools surroundings, creates moisture through respiration, attracts clouds and precipitates moisture, and all this stabilizes climate. Climate models do not include proper calculations of the effect of increasing destruction of natural vegetation which will allow atmospheric carbon dioxide levels to increase and progressively limit massive surface cooling effects.
Perhaps biology and botany is not your specialist field but it would be useful to see 50 year historical records graphically depicting loss of natural vegetation versus global temperature increases. I would also like to see an accurate comparison of mankind’s increased emissions of greenhouse gases versus natural emissions of greenhouse gases as a result of mankind’s interference with nature. Thanks, Mike