A bit more controversy to chew on ..
In my last post I talked about a new (highly questionable) theory to explain ozone depletion. In support of their theory, the proponents noted that a purported ‘ozone hole’ over the tropics is unexplained by current theory. It certainly isn’t explained by their theory either. The idea of a ‘tropical ozone hole’ was introduced in a single-author paper by one Qing-Bin Lu in Canada. It’s far more rigorous than the one I discussed last. Quite nice work really, for the most part. But its conclusions are questionable. And to label the effect as an ‘ozone hole’ is an alarmist beat-up.
Lu’s paper shows large decreases in tropical ozone at altitudes below 20 km, especially over the period 1960 to 1980, when the only data source was from sparse and indirect ground-based data, or from the even more sparse balloon-borne measurements which have well-documented uncertainties and changing systematic errors over time. After the advent of satellite data in the 1980s, the changes are miraculously much smaller - despite our ever-increasing emissions of combustion products.
An ozone hole in the tropics, if it existed, would of course be much more serious for UV damage than the well-known Antarctic ozone hole. Firstly, with the higher sun elevations, the path of sunlight through the atmosphere is much shorter, so UV intensities are already much stronger. Secondly, low latitudes are the home to billions more people and a far greater biological diversity.
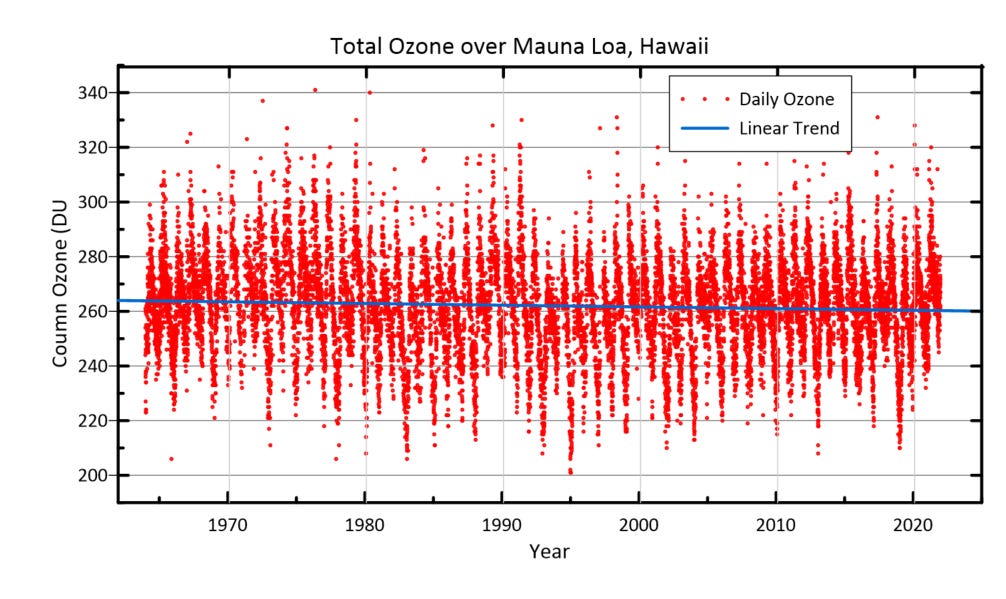
But does it actually exist? The answer is no, although ozone amounts are lower there than at higher latitudes because of global air circulation patterns which rapidly transport stratospheric air from low latitudes to high latitudes (the process is called the Brewer-Dobson circulation). The uplifting air in the tropics results in total ozone amounts there regularly falling below the 220 DU threshold which is commonly used to define the Antarctic ozone hole, where ozone amounts were historically much higher (the global average ozone amount is about 300 DU). But that 220 DU threshold is inappropriate for the lower naturally-occurring ozone amounts in the tropics. The lowest ozone amount I know of in the tropics was measured in Hawaii. That was about 200 DU, whereas under the Antarctic ozone hole it regularly falls below 100 DU.
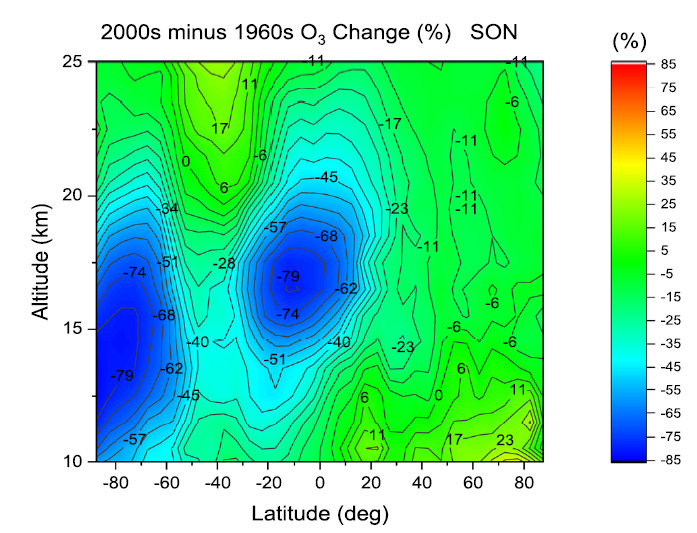
The data shown in Lu’s paper do look convincing at first sight - especially if you weren’t aware of the limitations I mentioned above. As shown below, their long term ozone reductions below 20 km in the tropics can approach 80% - similar to those in the Antarctic spring (that SON in the title means the average for September+October+November).
But if you look closely at the plot, you’ll see that those changes in Antarctica are too low down. The real ozone hole there is from ozone destruction at altitudes above 15 km, which is why they have such a dramatic effect on the total ozone amount. If you look at other plots in Lu’s paper, you see that the largest changes there occurred too soon: before 1980. The largest changes in real Antarctic ozone hole were after 1980. It is interesting that the long term ozone ‘reductions’ were smaller in other seasons, so it’s not entirely a data calibration issue. That make me wonder if the changes they see are a consequence of incomplete sampling of the data, especially in the early period prior to 1980, when measurements would have been weather-dependent. Ozone has a strong seasonal variability, especially at high latitudes, so even small changes in data sampling dates could have a large effect.
Unlike the situation in Antarctica, any changes in the total column ozone are small at tropical latitudes. The most reliable long-term measurements of ozone in the tropics are from Hawaii (19.5N), a latitude near the edge of the region of largest change in the figure above. According to the above figure, ozone reductions greater than 30 percent occurred at some altitudes above that site.
The long-term changes in total ozone since the 1960s shown below confirm that any changes in total ozone have been small over Hawaii. The plot shows that even at this much lower latitude, there are large seasonal variations in ozone. After averaging those out, the blue line on the plot shows that over last 60 years, ozone has decreased by about 5 DU (less than 2 percent). In fact, it has increased slightly since the mid-1990s when the concentration of atmospheric chlorine from CFCs reached its peak.
Lu’s reported decreases in ozone are significant only at altitudes less than 20 km, much lower than the peak of the ozone layer. So even with large percentage changes below 20 km, their effect on the total column amount of ozone is small.
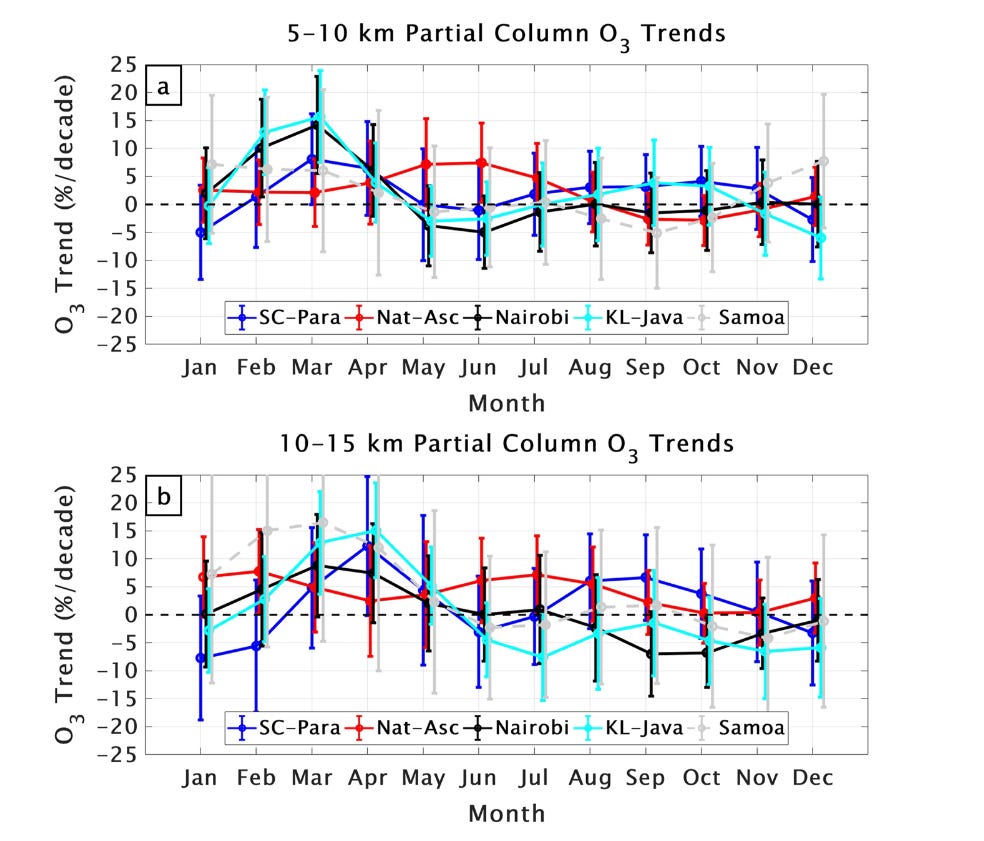
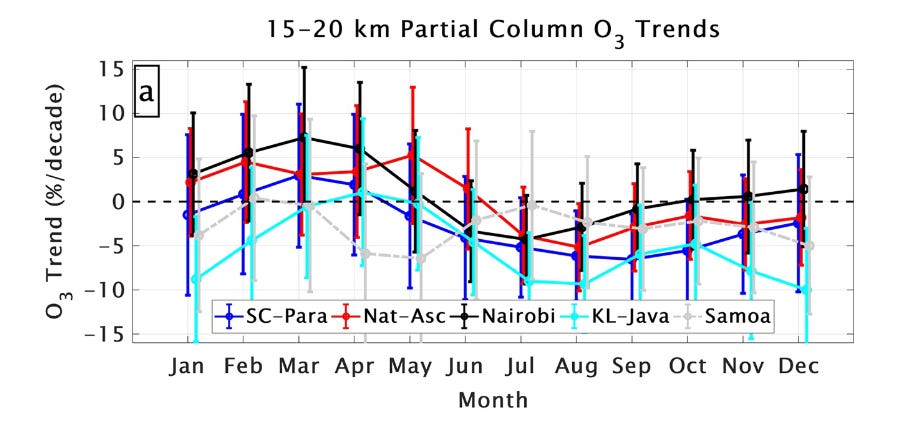
But are those big ozone reductions below 20 km even correct? When I saw Lu’s paper I immediately thought of a long-running measurement program to understand ozone in the tropics changes using the best-available balloon-borne measurements. That should provide the definitive evidence, I thought. Coincidentally, new results from that program have just been published in a recent atmospheric science community Newsletter. The article, led by NASA’s Anne Thompson, appears on pages 14-21 of the newsletter. It’s probably a bit heavy-going for most of you, but the plots that summarize long-term changes in the relevant region are reproduced below (I got these versions from the higher-quality images in their original paper that the newsletter article is based on). Unfortunately, the quality-assured data in this program starts only in the late 1990s, several decades after the largest changes reported by Lu. The plots show monthly trends since the late 1990s in ozone at 5 tropical regions spanning a wide geographical range in three altitude ranges: 5-10 km, 10-15 km, and 15-20 km.
Over that more recent period, the changes are much smaller. Contrary to Lu’s work, the plots show a seasonal variability in even the sign of the ozone changes. In some seasons it’s increasing while in others it’s decreasing. It’s not homogeneous geographically either. There are significant differences in trends between the 5 regions. And the overall annual changes below 20 km are small: less than 5 percent per decade at all five regions (noting that increases in some height ranges tend to be compensated by decreases in others).
Ozone changes of that magnitude in those height ranges don’t really matter from an environmental health perspective. In the tropics, about 90 percent of the ozone is at altitudes greater than 20 km. The altitude range below 20 km therefore contains only about10 percent of the total column, so a 5 percent per decade change there contribute less around 0.5 percent per decade in total column ozone. The data shown above for Hawaii confirms that the column ozone changes per decade are even smaller than that (closer to 0.3 percent per decade). They therefore have very little effect on UV radiation.
Although not important for UV, we still need to be confident that the small systematic changes in ozone are consistent with theory. Our current understanding is that it’s linked to climate change. Under climate change, the Earth’s surface warms while the stratosphere above cools. The resulting larger temperature differences between the surface and the stratosphere accelerate the normal (Brewer-Dobson) global circulation pattern of ascending air in the tropics and descending air at higher latitudes, so tending to reduce the amount of ozone in the lower stratosphere in the tropics. I’m told by climate-modellers that the observed changes in ozone are entirely consistent with that (though I’d like to know more detail, and how to share it without jargon).


Sorry about those typos ...