Questionable UV "Science"
Last weekend I was talking to my colleague, Germar Bernhard, about what to do about a just-published paper that was full of errors on the causes and effects of ozone depletion: a subject near and dear to my heart. We were concerned because it reproduced the main figure from a paper we’d published a few weeks back, and then misinterpreted it to back up their theory.
Their paper really needs rebuttal, but we decided against giving their ideas oxygen in the formal peer-reviewed literature. Thinking about it later, I thought it would be good to at least record our thoughts about it here for posterity.
It’s a strange paper. If you’re so inclined, you can read it here. But I wouldn’t recommend putting too much stock in it. I’ve never heard of the journal. It goes by the grand title of the European Journal of Applied Sciences. It seems to have been around for a couple of years, but I can’t find any information on its Impact Factor. It apparently has pretty lax peer review standards too. Only a few days elapsed between the authors requesting the use of our figure and the final publication. That’s not much time for any meaningful two-way interaction that should have happened under rigorous peer-review - especially in this contentious case.
The authors reckon the atmospheric science community have got it all wrong, and that ozone depletion isn’t caused by chlorine and bromine from CFCs and their replacements. Meaning my last 40 years work has been a waste of time.
But they fail to explain what’s wrong with the current theory, which is not in dispute because it is fully in line with observations. For example, the observed decline in ozone and beginnings of recovery are strongly correlated with observed increase and decrease in atmospheric chlorine. And they fail to explain how their own model is replicated with observations.
In their alternate theory the culprit is tiny particles of ash that are emitted from the smokestacks of coal fired boilers (they call it “coal fly ash”). They posit that this ash is somehow lofted high into the stratosphere to do the damage. Their theory is light on detail, and is premised on the false assumption that the problem is still getting worse. As my own recent posts show, its actually getting better, just as expected - now that atmospheric chlorine is on the decline.
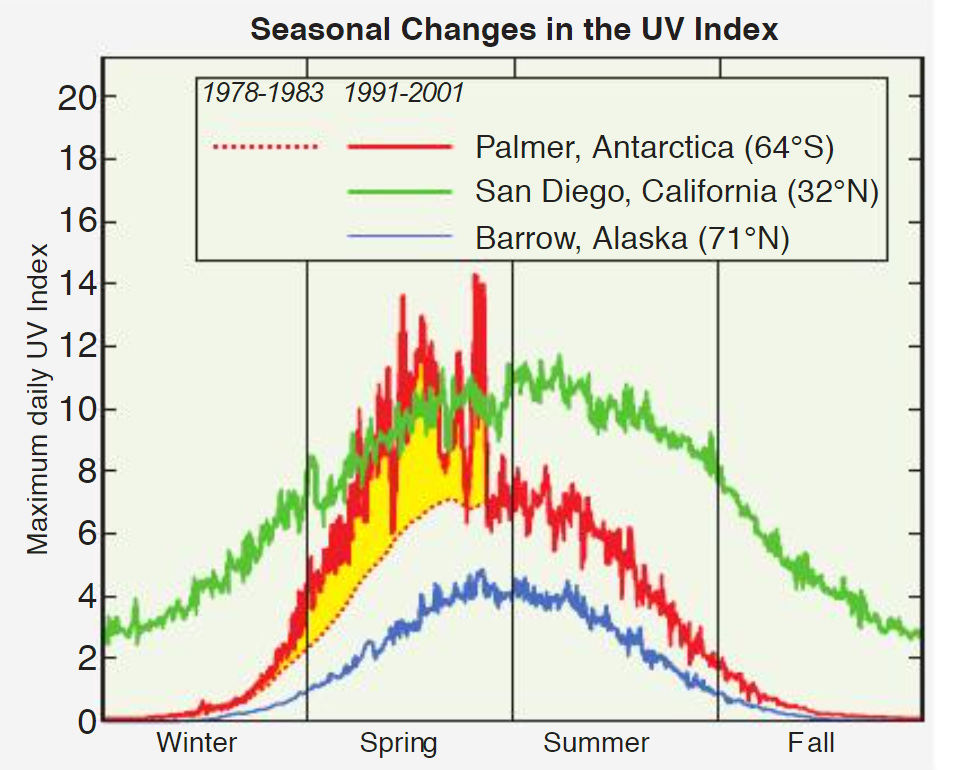
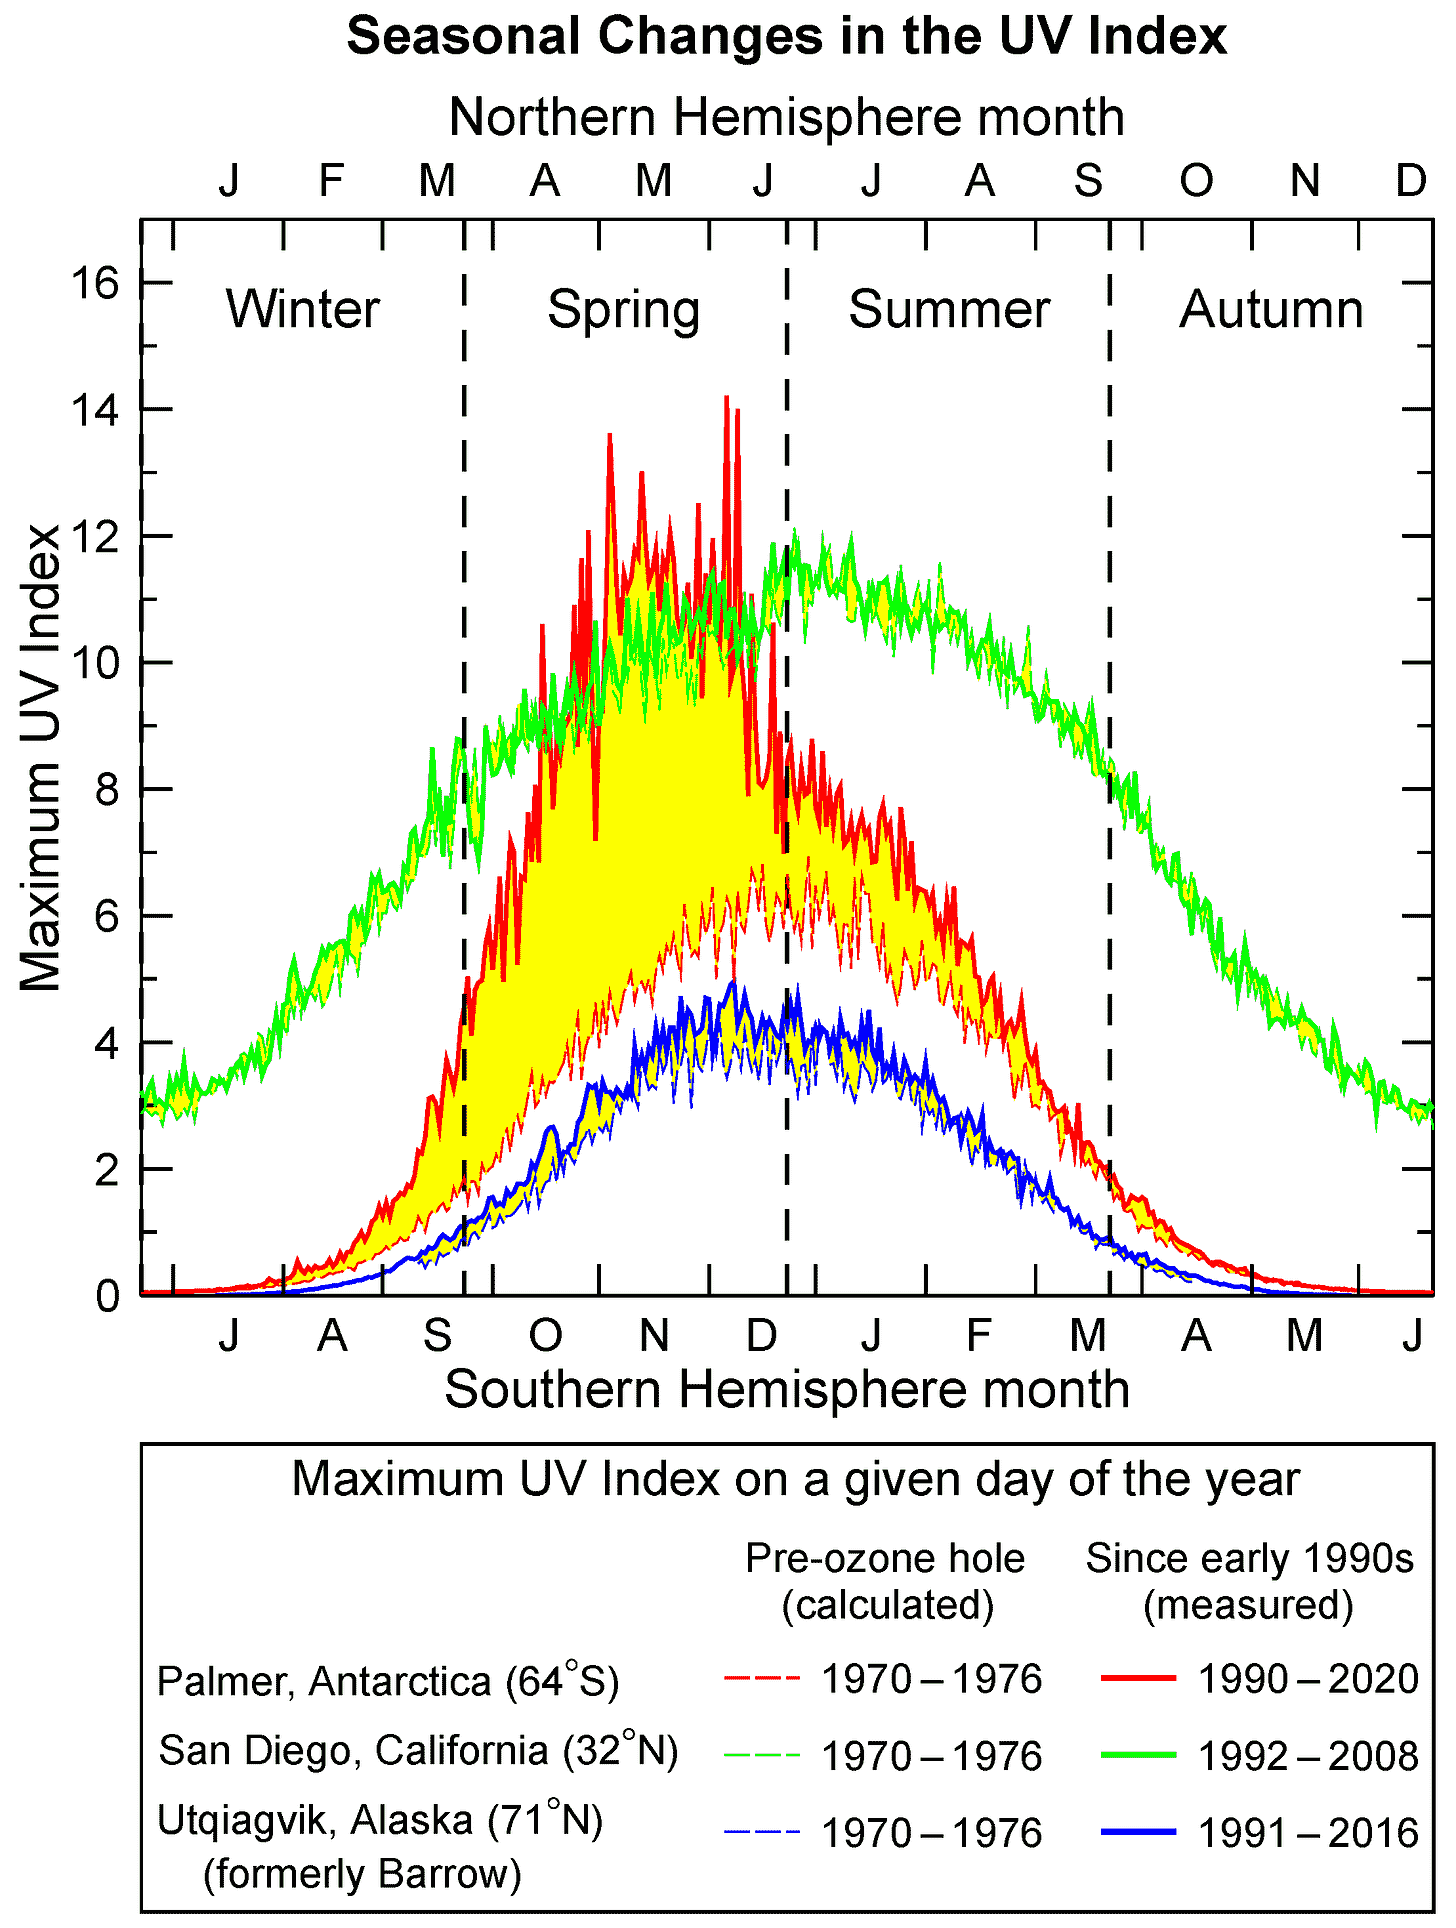
Their use of our plot to try and prove their point that UV is getting worse actually disproves the point they’re trying to make. If they’d read our paper carefully, they’d have seen that our figure is an update of one that first appeared twenty years ago. Here’s the original version from 2002.

and here’s the 2022 update …

There are only minor differences between the 2002 version and the one published this year, showing that the bulk of any increases in UV occurred prior to 2002 (just as expected from the ozone changes shown here and here). I challenge you to spot the differences compared with the later plot. The peak UVIs published way back then are essentially the same as in the 2022 update. It’s mainly just the historical context that’s been improved.
Their paper is full of “mights” and “maybes” which never sit well in real scientific papers. It’s much better to do the work than to merely speculate. For example, if the amount of coal ash were really increasing in the stratosphere, its effects would show up clearly in ground-based data from LIDAR measurement systems which regularly probe the upper levels of the atmosphere from places like Lauder. But no such effects are seen. And not surprisingly either. It takes a lot of energy - like from volcanic eruptions - to push articles up to those heights. As with CFCs, if the ash becomes well-mixed throughout the lower atmosphere (and isn’t washed out by rain), there will be a small leakages up to the stratosphere. But the ash particles are heavier than molecules of CFCs, and most would fall down again through gravitational settling.
The authors also raise again the old chestnut that the amount of UVC reaching Earth’s surface is increasing, despite the errors of those measurements having been spelt out to them by many - including me. Any apparent UVC irradiance signals supposedly detected at Earth’s surface can be trivially explained by their too-simple instruments not being up to the demanding task of measuring tiny amounts of UV radiation in the presence of overwhelmingly large amounts of light. To be clear: essentially no radiation from the Sun at UVC wavelengths (100 to 280 nm) reaches Earth’s surface. In fact, there’s none at any wavelength less than 290 nm, further out in the UVB region.
They also claim, in their conclusion (no less), that the continuing increases are obvious because “…all it takes is to go outside and feel the sun burn your skin …”. That’s hardly a quantitative measurement of UV radiation. It would never get past a real reviewer. Any physiological response like this would depend on past exposure, skin thickness (which changes with age), length of time in the sun, sun elevation, etc. It’s not just ozone.
It’s also unlikely that the ‘burning’ sensation they mention is really due to UV radiation. There’s insufficient energy at those wavelengths to raise the skin temperature appreciably. That’s all due to visible and infrared radiation which comprises at least 95 percent of the Sun’s energy transmitted to Earth’s surface. Indeed, one of our problems with UV radiation is that our bodies have no sensors to detect it. It’s only hours afterwards that we become aware of over-exposure effects - when skin-reddening (i.e., erythema) develops. By then it’s too late.
But what’s particularly telling in this case is that ozone changes have been very small at the latitudes near 30 degrees north where both authors live. One is from San Diego, one of the three sites shown in our figure. The 2022 version of it confirms that there has been essentially no change in peak UV at that site. Again, the data the authors use to try and prove their point actually disproves it. It shows that changes in UV are not the reason for his feeling more burnt (at least up to the year 2008 when regular measurements there were discontinued through lack of funding).
Fortunately, we know from measurements at other sites that the UV hasn’t increased since 2008. But sadly, San Diego is not the only site where high quality UV measurements have been discontinued through lack of funding. Without such measurements, we are at risk of not being able to answer these questions.
It’s possible - I suppose - that the sort of questions raised in the paper may help revitalize funding to enable measurements to continue. If so, perhaps it could be considered a good thing despite its obvious errors. But that’s pretty unlikely with the evidence presented so far.
One possible area for further investigation is the idea of direct ozone loss on particles of ash without invoking the complex heterogeneous chemistry that’s implicit in our current understanding of polar ozone loss. It’s well known that ozone is destroyed on contact with most surfaces. If the authors feel so strongly about their theory, they should attempt to show an inverse correlation between ozone and the concentrations (or surface area) of ash particles in the stratosphere. I doubt if the correlation will be as convincing as that for chlorine.


I'm now actively encouraging readers to provide feedback ...
Hope to hear from you.