Oopsy, Ozone Loss Persists
Welcome back!
Before I start, I must apologise for some sloppy editing in last week’s app post. Think of it as an IQ test (but only if you managed to decipher what I meant). Clue: The words “…lick on the colour-cided …” should have been “…click on the colour-coded …” . And they weren’t the only errors. Anyway, the corrected version of the post is available here.
So what now …
Well, it looks like I’m in danger of having to eat my words about ozone depletion. This year’s Antarctic ozone hole has shaped up to be a real doozie, with record low ozone amounts for this time of year. As I mentioned previously, low ozone late in the season is potentially more troublesome for UV.
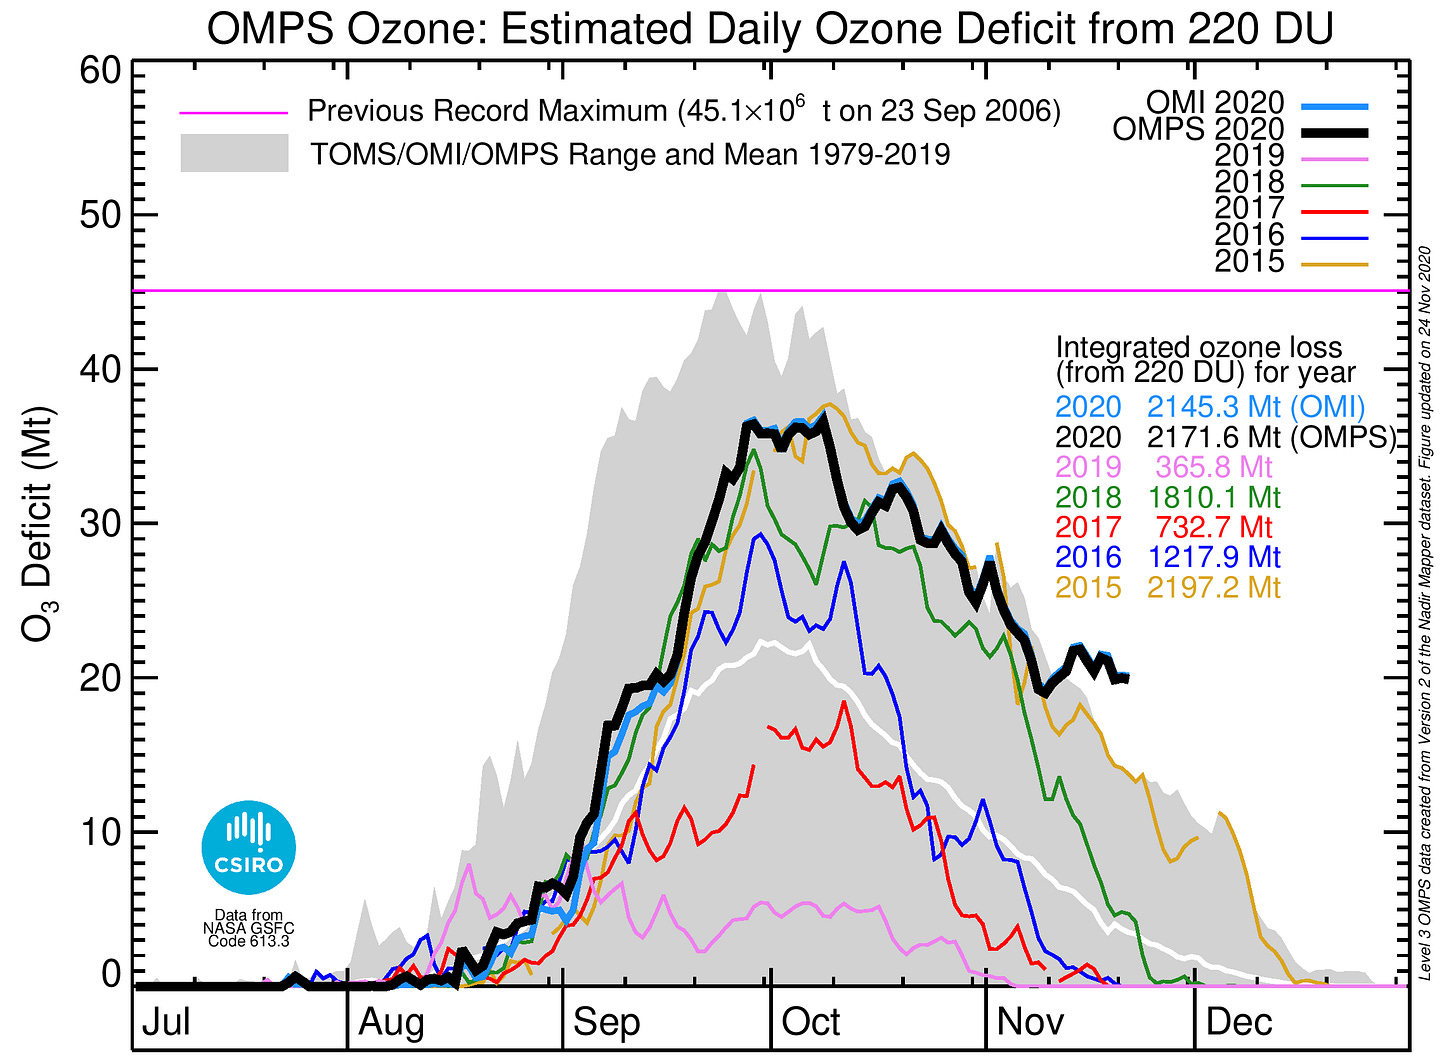
Several metrics are used to describe the severity of the ozone hole. For example, the minimum ozone amount, or the area where ozone is less than some threshold (e.g., less than 220 Dobson Units (DU)). But for me the most relevant one is the amount of ozone destroyed. In these terms, the situation for this year is summarized in the plot below, below, which was produced by Paul Krummel and Paul Fraser at Australia’s CSIRO using NASA satellite data.
You can see that for the past week or so, we’ve been in uncharted territory. The black line has been above the grey shaded area, showing that the amount of ozone missing in the second half of November this year is more than it has ever been. In contrast, in some other years (e.g., 2016, 2017, 2019) the hole had fully recovered by now.
The total amount of ozone destroyed this year can be represented by the area under the black curve. Already this year it exceeds 2140 million tons. By the end of the year, it may well be an all-time record, though it’s doubtful if it will exceed the envelope for all past years (shown in grey).
Incidentally, you might wonder why is there so much variability in the size of the ozone hole from year to year? It’s because of year-to-year differences in wind patterns. If the winds flow concentrically around the pole (i.e., in a polar “vortex”) without excursions to lower latitudes - the air is exposed to less sunlight so remains colder. That cold air is just what’s needed for formation of the ice crystals on which ozone depletion chemistry proceeds most rapidly. This spring, there was a strong polar vortex, so the air was exposed to less sunlight. It was also more cut-off from other latitudes so there was less mixing. In contrast, the polar vortex was much weaker last year (2019), so the air wasn’t so confined. Similarly, ozone holes rarely occur in the Arctic because the underlying non-symmetric topography induces waves that favour excursions of the air to lower (warmer sunlit) latitudes.
The good news is that in the decades ahead, ozone holes will become progressively smaller on average, as the amount of chlorine in the atmosphere reverts to natural levels.
It will be interesting to see if these low ozone amounts so late in the season have any measurable effects on UV in New Zealand over the summer as this ozone-poor air dissipates. I’ll keep you posted. Thanks for listening. Click below for more occasional free updates on Ozone, UV, Climate and Health


Richard, Can you also show the history of levels of Ozone depletion for the first half of the year?