Production of vitamin D in sunlight revisited
It may be a bit harder than we thought in winter ..
This is a bit more ‘sciency’ than normal. It’s my follow-up thoughts after a zoom talk titled “Experimental Inconsistencies” that I gave a CIE* Workshop on an Action Spectrum for Previtamin D, convened by Ann Webb, 28 September, 2021. This is the sort of thing I used to get paid to do. Nowadays its only for fun. I hope you enjoy it too.
* CIE = Commission Internationale de l’Eclariage (i.e., the International Light Commission)
Setting the Scene
It turns out that there may be a problem. Our bodies need vitamin D, and we get most of it from exposure to UV in sunlight. But it now seems that its production in winter sunlight might be more difficult than previously thought.
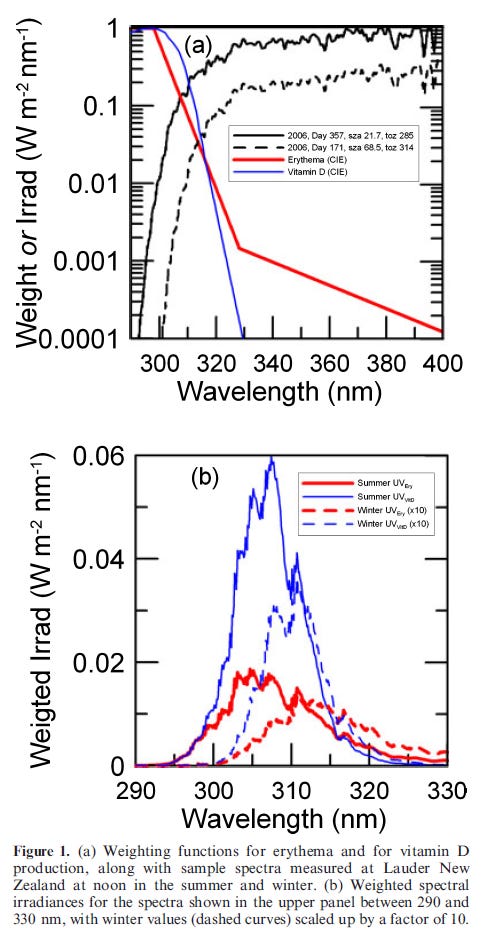
We predicted over a decade ago that there might be a problem, but until now it was just a prediction. The figure below is from the paper I wrote about it in 2009. It’s a great help in explaining the problem.
The upper panel compares the currently accepted CIE action spectra for erythema (sunburn), and the production of previtamin D (the first step in the formation of vitamin D from sunlight). It also shows the noon spectral irradiance from sunlight falling on a horizontal surface near the summer and winter solstices under clear-sky conditions at Lauder, New Zealand (45°S).
The lower panel shows the corresponding irradiances weighted by those action spectra. The effective totals are given by the area under those curves (noting that winter curves have been scaled up by a factor of 10 for clarity).
Inconsistencies
As we showed in our paper, application of the CIE action spectrum for previtamin D production (Bouillon et al., 2006) implies that some production should be possible throughout the year at this site. For example, the noon production for the mid-winter spectrum should be about 5% of that for the summer spectrum, as can be seen by comparing the areas under the blue curves in the lower panel of the figure. Nearly half of that winter contribution comes from wavelengths greater than 313 nm.
By contrast, the amount of sunburning radiation in the winter spectrum is closer to 10% of that in summer, as shown by comparing the areas under the red curves. The winter and summer values correspond to UVI 1.0 and 10.4 respectively. With a longer tail in the weighting function for erythema compared with previtamin D production (seen by comparing the blue and red curves in the upper panel of the figure), significantly more than half the sunburning radiation in the winter spectrum is from wavelengths greater than 313 nm.
As was also shown in our paper, when UVI = 1, sufficient vitamin D (equivalent to a daily dose of 1000 IU per day) should be produced for a full body exposure in approximately 20 minutes near solar noon (compared with less than 1 minute in summer). If just hands and face are exposed, as is more likely in winter, it would take about 200 minutes, making it difficult in practice to maintain optimal vitamin D status in winter. However, approximately 5% of the summer contribution should still be detectable, at least under controlled conditions. Note that these times would be reduced by 30% after applying the subsequent corrections suggested by Dowdy et al., in 2010.
But others have said - prior to the publication of the CIE action spectrum for previtamin D production - that none should be produced in winter at these latitudes.
Solar elevation is a strong determinant of surface UV, and because of Lauder’s more poleward latitude (45°S), the amount of UV radiation present there in winter is significantly less than at Boston, USA (40°N), and at other sites at the same latitude. [1] The finding that 5% of the summer vitamin-D is produced when the UVI = 1 therefore contradicts the assertion that no vitamin D production is possible in winter from sunlight poleward of 40°N. This suggests that the CIE action spectrum for previtamin D may be incorrect
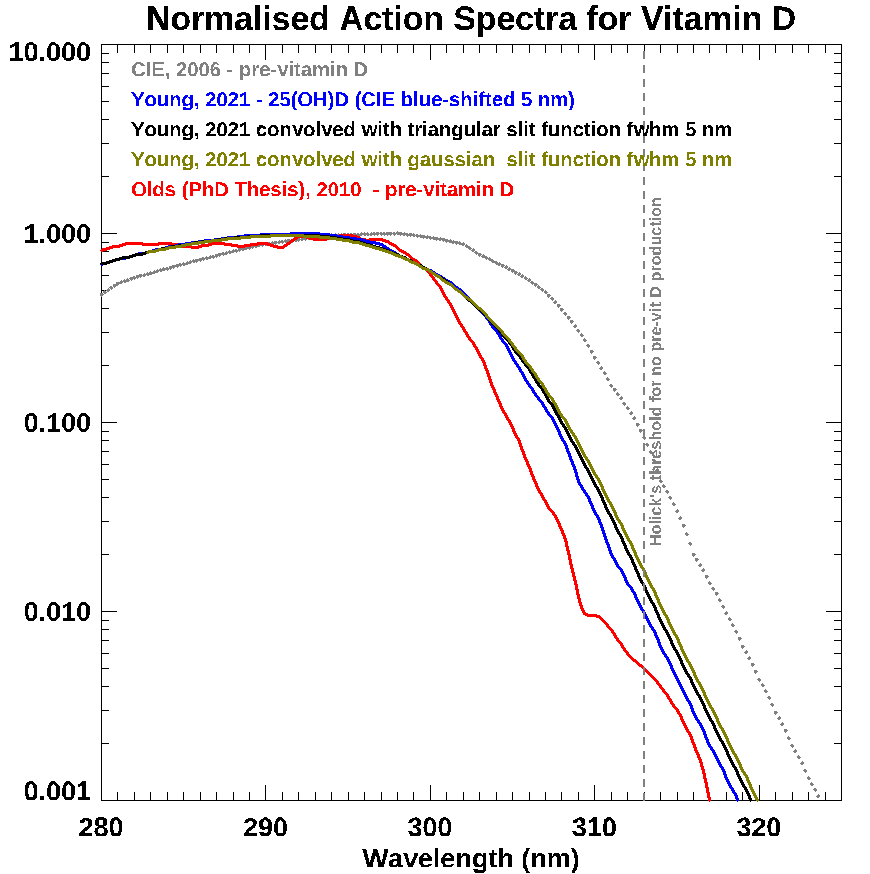
A paper just published showed that better agreement between UV exposure and vitamin D status, as measured by the concentration of blood serum 25(OH)D results if the CIE action spectrum is shifted down in wavelength by 5 nm. This would bring the CIE action spectrum closer to other estimates, such as that shown in red.
The CIE action spectrum was deduced from experiments using a monochromator with a slit function of width 3 to 5 nm (MacLaughlin et al., 1982). I speculated during our zoom meeting that perhaps a wavelength bias from that finite bandwidth may have been sufficient to explain the 5 nm shift. I’ve since looked more closely into this.
The plot below shows that shifts approaching 2 nm are feasible.

But shifts as large as 5 nm are unlikely, unless:
Errors in the monochromator wavelength scale were significant. Elsewhere in the paper the wavelength accuracy is stated as only ± 5 nm, and/or
The monochromator was incorrectly tuned, so leading to aberrations that significantly distort the expected slit function from the pure gaussian or triangular shapes I’ve assumed, and/or
Radiation from the 5 kW xenon arc source that was used increased markedly with wavelength over the range 290 to 315 nm.
Further to that last point. Details of the spectrum from this particular lamp weren’t provided in the paper, but if for example its shape in the UVB region approximated the solar spectra shown in the first figure above, then the wavelength bias calculated above could be approximately doubled (assuming the positive slope of the lamp spectra matched the negative slope of the action spectrum).
During our zoom meeting, Michael Holick showed a slide based on an old 1938 paper by Knudson and Benford that appears to have used narrow spectral lines from a low pressure lamp (like a mercury lamp) rather than a continuous source, so the wavelength scale should be accurate. That study reported that no previtamin D is produced from wavelengths longer than 313 nm. A possible explanation is that some was indeed produced, but the amount was too small to be detected. As you can see from the above plot, it’s already two orders of magnitude less than its peak near 297 nm by then (but still potentially important in sunlight because its intensity increases so steeply with wavelength in the UVB region due to the decreasing absorption by ozone - as shown in the upper panel of Figure 1).
But if it’s really true that none is produced at 313 nm, then there’s a clear inconsistency with the 1982 data used to create the CIE action spectrum. That clearly shows a non-zero response at 315 nm, and even a just-detectable response at 320 nm. It’s interesting to note that all of the candidate action spectra shown above remain non-zero at wavelengths longer than 313 nm.
Mathematical deconvolution of the current CIE action spectrum (and possibly allowing for a further downward shift within the experimental uncertainty in wavelength) could conceivably give a curve that’s effectively limited to wavelengths less than 313 nm and so remove that inconsistency. That deconvolved spectrum would also drop off more steeply than the current version. It would be instructive to repeat the analysis of Young et al using this version of the action spectrum to see if correlations are improved.
Implications
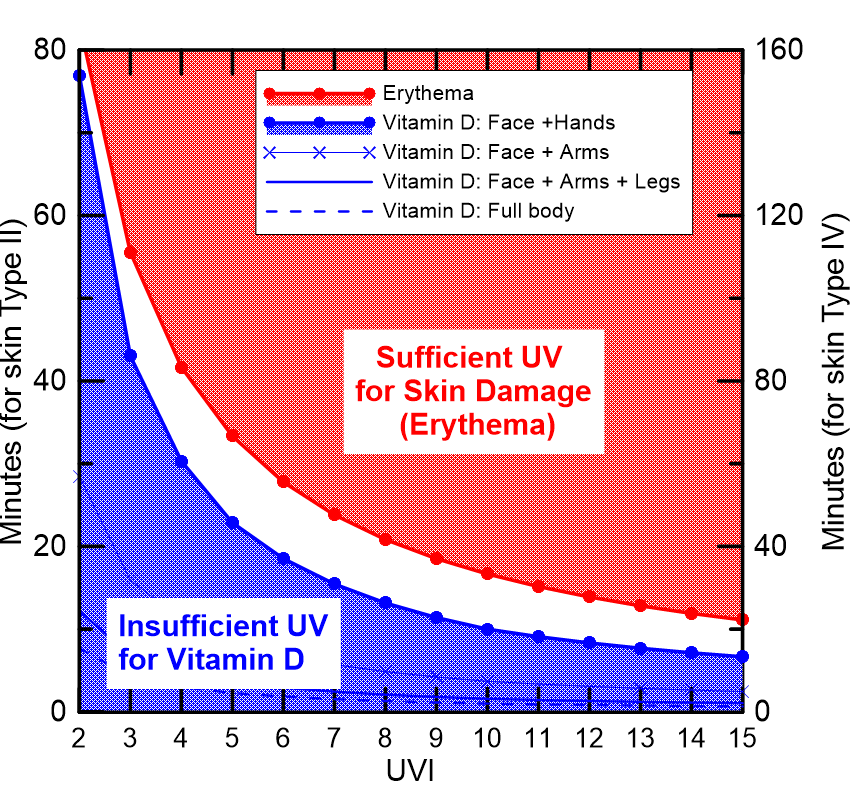
As Robyn Lucas noted at the outset of her presentation, any change in the action spectrum associated with the production of blood serum vitamin D could have important implications for health messaging. The effect of the shift to shorter wavelengths would make the blue curves in the plot below steeper, so reducing the area of the white ‘goldilocks zone’ between not getting enough UV for vitamin D sufficiency, and getting too much for skin health.

This in turn could require changes to health messaging, such as provided in our GlobalUV smartphone app. Calculations by my colleague, Germar Bernhard, show that using the wavelength-shifted version of the CIE action spectrum increases the calculated exposure times at low UVI by up to 50 percent or so. Luckily, much of that increase would be offset by the correction suggested above in 2010, so any changes to the exposure times shown in the plot wouldn’t be huge.
But more work is still needed. It’s not yet obvious that we’ve homed in on the best action spectrum for previtamin D production. Hopefully as a result of this workshop followup work will converge on a satisfactory action spectrum that’s consistent with observations in sunlight.
In the meantime, we’ll just have to make do with what we have. But we should keep in mind that the exposure times needed for vitamin-D sufficiency may be biased low in winter.
[1] Factors other than solar elevation can also affect UV, but they don’t change this conclusion. The effect of altitude difference between the two sites is small. The slightly larger column amounts of ozone in winter at Boston contribute to UV reductions of less than 5%. UV there could be further reduced by 20% due to aerosol extinctions, but the shorter Earth-Sun distance during the northern hemisphere winter leads to a compensating increase of 7% compared with Lauder. Such changes are small compared with those due to solar elevations being 5-degree lower at Lauder in the winter, a difference that leads to the previtamin D weighted UV being reduced by about a factor of two (and by more than a factor of two if that CIE action spectrum is shifted to shorter wavelengths). Our spectrometer system at Boulder CO (40°N, alt 1.6 km) shows that the peak previtamin D weighted UV in winter there is twice that at Lauder.
Thanks for reading this. Previous posts on the intersection between Ozone, UV, Climate, and Health can be found at my UV & You area at Substack. Click below to subscribe for occasional free updates.


