Last week I speculated whether exposure to sunlight might be beneficial for stopping Covid-19 in its tracks. I showed that in summer at mid-latitudes, sunlight does provide protection, but only for exposure periods of around 1 hour. But I also mentioned that uncertainties were large. Here I have another look at the problem. The UV in sunlight could do better than I thought.
UV radiation is at the crossroads of many disciplines other than atmospheric physics. In humans, its skin damaging effect that can lead to melanoma skin cancer has been well documented. But there are also beneficial effects. One is its role in the production of vitamin D necessary for good health. Another is its potential to inactivate pathogens such as bacteria and viruses, as I discussed last time.
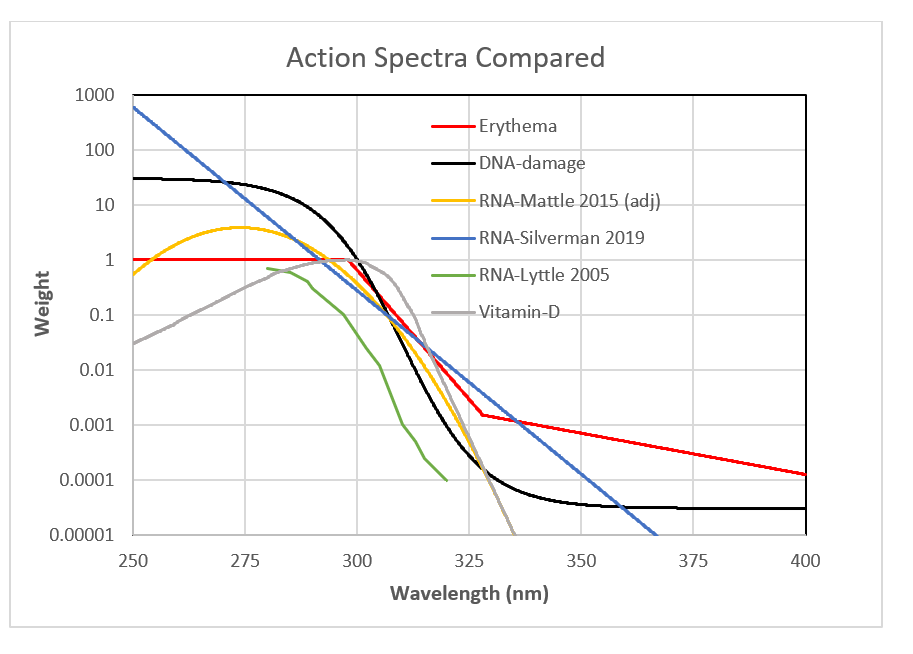
The wavelength dependence of damage is called the ‘action spectrum’. When I wrote that last post on this subject, I didn’t have access to an action spectrum for RNA, so I assumed its shape would be similar to that for the often-used action spectrum DNA.
A paper published last year helps to redress that problem. In the figure below, the new action spectrum for RNA is compared with several others, including earlier estimates for RNA. Notice that the y-axis is plotted on a logarithmic scale that spans 8 orders of magnitude. Action spectra are arbitrarily normalized, but the normalization wavelengths differ between these various spectra.

The earliest action spectrum for RNA shown, by Lyttle (2005), has values at only a few points. Those from Mattle (2105) and Silverman (2109) are represented by analytic functions, which I’ve used - with low confidence - to extrapolate from their lowest wavelength wavelength published (near 280 nm) down to 254 nm. Note that the Mattle spectrum shown includes adjustments noted in Silverman’s more recent paper.
Comparing these curves, its not obvious whether using the action spectrum for DNA instead of that for RNA caused a significant error. The green curve is rather a close match to the DNA spectrum, whereas the newer results (yellow and blue) doesn’t drop as steeply as DNA’s through the UVB region, and beyond about 320 nm becomes steeper at the same time as the DNA curve becomes less steep.
Its unfortunate that the published spectra for RNA are limited to wavelengths longer than 280 nm, which is far above 254 nm, where most sensitivity tests have been made. The earlier action spectrum (green) is too noisy to extrapolate, but the extrapolation of the other two give hugely disparate results. As any mathematician or physicist will tell you, extrapolation is fraught with danger, especially over large intervals such as here. I’m skeptical about these new spectra for RNA for two reasons. Firstly, they’re very different from that previously reported (green), which was much more like the spectrum for DNA (blue). Secondly, I’m surprised that the biological effect can be so well represented by a simple function. Of course, the same criticism could be levelled against the curve for erythema. The three-piece curve is even less plausible. It’s just an agreed-upon approximation to measured data.
Given my discomfort about the simple exponential approximation which was no doubt tuned to be OK in sunlight reaching the Earth’s surface (i.e., for wvl > 290 nm), I’m even less comfortable about using it to extrapolate. I’d prefer to “eyeball” the result, or use just extrapolate from wavelengths below 300 nm with a function that mirrors the shorter wavelength-dependence of DNA. I estimate of the extrapolated value at 254 nm is around 15 for Mattle’s RNA spectrum (about half that for DNA). The uncertainty in that is large, but difficult to estimate. Let’s say it could be a factor of two out.
Over the same wavelength UV-B interval that the damaging effect decreases most rapidly, the spectrum of sunlight increases rapidly because of the decreasing absorption by ozone at longer wavelengths. It turns out the most important wavelengths are around 305 to 310 nm. At shorter wavelength there’s not enough sunlight because ozone absorptions are too big. At longer wavelengths the action spectrum for damage becomes too small.
To a first approximation, the relative sensitivity to damage in sunlight between various action spectra is governed by difference between their values at 254 nm where the tests are done, and 305 nm where effects in sunlight are felt. For DNA that looks like about 2 orders of magnitude because the effect is about 100 times smaller at 305 than at 254 nm. For Lyttle’s estimate of for RNA (green), the result looks similar. But for the Mattle’s spectrum that difference is closer to a factor of only 10. If that were the case, the calculated inactivation times would be about 10 times shorter. Instead of inactivation occurring in about 30 minutes for highest sun, it would be closer to 5.
But taking Silverman’s extrapolated curve at face value, its value at 254 nm is about 600 and the difference in sensitivity between 254 and 305 nm would be close to a factor of 1000. In that case, there would be essentially no inactivation by sunlight. But that value at 254 nm is probably much lower than indicated by the simple extrapolation ….
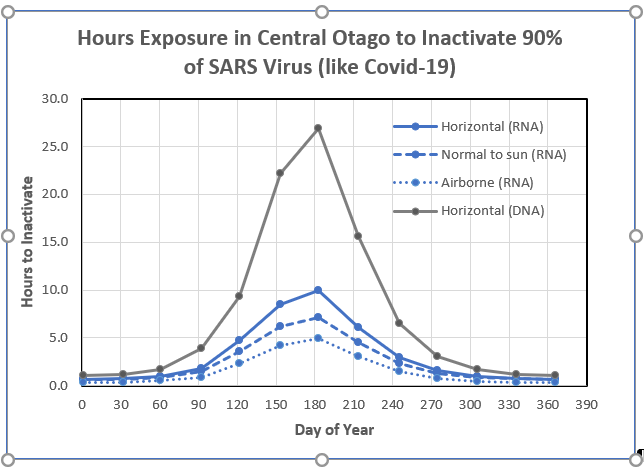
Despite all these uncertainties, I tried recalculating inactivation times using Mattle’s action spectrum, but with my estimated extrapolation of 15 at 254 nm (rather than from the extrapolated function shown on the plot).
Results are shown below, where the grey curve is the calculation from my earlier post using the action spectrum for DNA. The calculated times with the action spectrum for RNA are less than half those calculated for DNA.

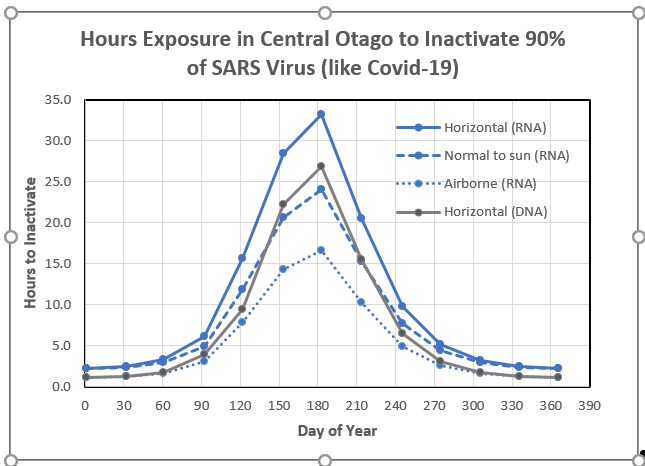
All the results shown so far assume that the dose to inactivate the virus is 20 J/m2. In the version below, I’ve recalculated the times for RNA inactivation assuming an inactivation dose of 67 J/m2, as suggested in last week’s post. As expected, the times are longer by a factor of three and are close to the values previously calculated using the DNA action spectrum. Both assume a normalization value of 15 for RNA.

So, the quantitative answers to our question are strongly dependent on the assumption we make about
1. The dose of UV required to inactivate this particular virus
2. The shape of the action spectrum though the UVB range
3. Extrapolation of the action spectrum back to 254 nm
But in all cases tested, we see that in summer significant virus inactivation on a horizontal surface within about an hour near solar noon. And, as mentioned in my last post, inactivation times for airborne viruses are a factor of two smaller. We can’t say much more until we more reliable information on those three items.
In the meantime, as the New Zealand winter approaches, it will definitely get harder and harder for sunlight to inactivate the virus. Active traces could probably remain on exposed surfaces for days without significant UV degradation, and even airborne viruses will survive.
According to these calculations, the exposure times to inactivate the virus are considerably longer than the times needed to induce skin damage. It’s still worthwhile seeking sunlight, but without getting sunburnt. That will at least inactivate some of the virus, and it’ll will help keep your vitamin D levels up, which may provide protection. But a better personal strategy over the winter months may be to take vitamin-d supplements, and to shower regularly with soapy water to slough them off your skin and down the drain (hopefully sewage systems have their own means of sterilization).
If you live in the northern hemisphere, your prospects for worthwhile inactivation are getting stronger by the day as you move into your summer.
It remains to be seen whether Covid-19 turns out to be more of a southern hemisphere problem – and less of a northern hemisphere problem- in the next few months. If it does, that would be consistent with UV in sunlight being significant.
Sorry it wasn’t a bit more definite. But I enjoyed the exploration ….


