Vitamin-D at your fingertips
Now available via the UVNZ app on your Smartphone
I really need to write a paper in the peer-reviewed literature formally reporting the things I describe below, but in the meantime …
Progress!! My friend Jerry Burke has updated the UVNZ app on both Android and iPhone platforms so it now gives guidance on the approximate number of minutes of exposure for vitamin-D sufficiency (limited to situations where the time required is less than 60 minutes). These exposure times are a function skin type, and the amount of skin exposed, both of which can be specified.
The dependence on UVI is from a paper we published in 2009, with the time for high sun being based on the old “Holick rule” advising daily exposure of 1/4 of skin area to 1/4 of the UV dose that would cause skin reddening - equivalent to an oral dose of 1000 International Units (IU) of vitamin-D. But we’ve applied a downward correction in the exposure times by a factor of 0.7 to account for an error in Holick’s original work that was noted a year after our paper came out. The correction was required to correct for differences in the spectral distribution of sunlight compared with the lamps used to specify the time in the laboratory. With that correction, the times are in good agreement with those deduced later from our own studies using personal UV dosimeter badges.
The exposure times required for darker skins are also shorter than previously estimated, based on a study published last year and some of our own work that shows only small differences in the capacity for vitamin-D production between different skin types.
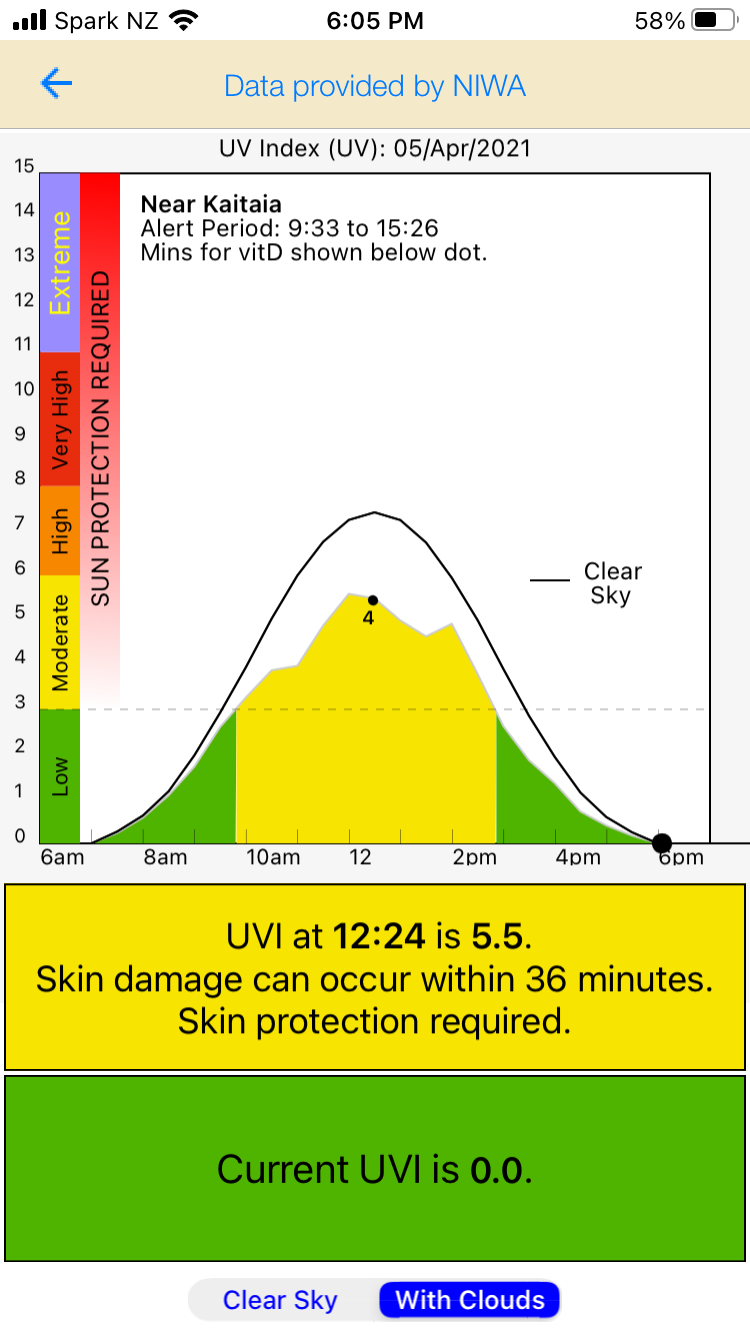
After downloading or updating the app, the first message you see is just the current UV Index for the location selected. But you can access the current exposure time required for your daily vitamin-D sufficiency from the “Details” screen, or the “Graph” screen, which shows the variability in UVI over the course of the day. The number of minutes needed at the current time is displayed - if less than 60 minutes- on the graph below the larger dot (omitted in this case because at 6:05 pm when the UVI was zero, it would be more than 60 minutes). For any other time - selected by touching the graph screen - the number of minutes required is shown below the smaller dot. Behavioural messages for sun safety shown for the peak time and for the current time selected in the colour-coded boxes below the plot.
You’ll quickly see that when the UVI is dangerously high, the times for vitamin D sufficiency are always much shorter than the times for skin damage. The example below is for at a site near the north of New Zealand a couple of weeks after the autumn equinox. It shows the exposure times needed for vitamin-D sufficiency for fair skin (skin type II) with 35 percent of the body’s skin area exposed. At noon, the app predicts that the UVI will be a “moderate” 5.5, and the time for vitamin-D sufficiency is about 4 minutes - compared with 36 minutes for skin damage (detected by skin reddening a few hours later).
As we go into the New Zealand winter, the times will increase - and eventually may not be shown even for noon if they become more than 60 minutes (maybe that’s when you should consider taking vitamin-D supplements) .
The app currently works only in the New Zealand region, but we hope to extend it soon to Eastern Australia. For those not lucky enough to be going into a New Zealand winter, we (mainly Jerry) are currently working on adding the same information to the GlobalUV App. I’ll let you know when that’s ready.
Thanks for getting this far. Previous posts on the intersection between Ozone, UV, Climate, and Health can be found at my UV & You area at Substack. Click below to subscribe for occasional free updates.


Richard, the other argument is that pollution and CO2 emissions from production of electric batteries offsets the benefit. We need a quantified cost/benefit analysis and comparison of electric cars versus petrol driven.
Hi Richard, Most predictions of sea level rise assume that the ocean has a fixed size and that more water from melting glaciers and icecaps translates to higher sea level. This is not strictly true. Indeed, measured sea level rise has always been a fraction of what scientists predicted. The reason is that the ocean does NOT have a fixed size. The thin crust of the earth at the bottom of the oceans floats on molten (plastic) magma. As melting ice from any warming land mass adds to the volume of water in the sea, hydrostatic pressure increases and pushes the ocean floor down deeper into the pliable magma. Simultaneously, the weight and pressure of ice on mountaintops decreases and allows magma to push upwards to make space for the magma which is displaced from the bottom of the oceans, creating a circle of mass movement and a tendency towards equilibrium. Furthermore, the thin crust of the earth is not static. It floats on molten magma and when solar and lunar gravity effects combine in different vectors and changes with solar apogee and perigee, oceans change slightly in depth and pressure, sometimes causing islands to rise very slowly and then fall slowly. Add to that higher than normal wind speeds and equinox king tides and we see more island lakes being swamped. The slight actual mean global rise in sea level through more water coming from warming continents is slight and only a minor contribution.